Gantt Chart Overview
The Gantt chart lets you visualize what your team decides to take into work. Prioritization gives you a ranked list — the Gantt chart shows what actually fits into your sprint, week, or quarter.
Why use the Gantt chart
Ducalis helps you decide what matters most through criteria-based prioritization, team alignment, and scoring. The result is a sorted list ranked by priority. But a sorted list alone does not answer:
- What tasks actually fit into this sprint or quarter?
- Who works on what, and when?
- Which tasks block each other?
The Gantt chart adds this missing piece. After prioritizing, you drag tasks onto a timeline to visualize your team's plan. You can rearrange it, adjust dates, and set dependencies as plans evolve — it is not locked in place.
The recommended workflow with Ducalis looks like this:
Unlike standalone Gantt tools, the Ducalis Gantt chart is connected to your prioritization data. Task scores, assignees, statuses, and other fields are available directly in the Gantt view — no need to duplicate information.
Where to find the Gantt chart
The Gantt chart is available in two places:
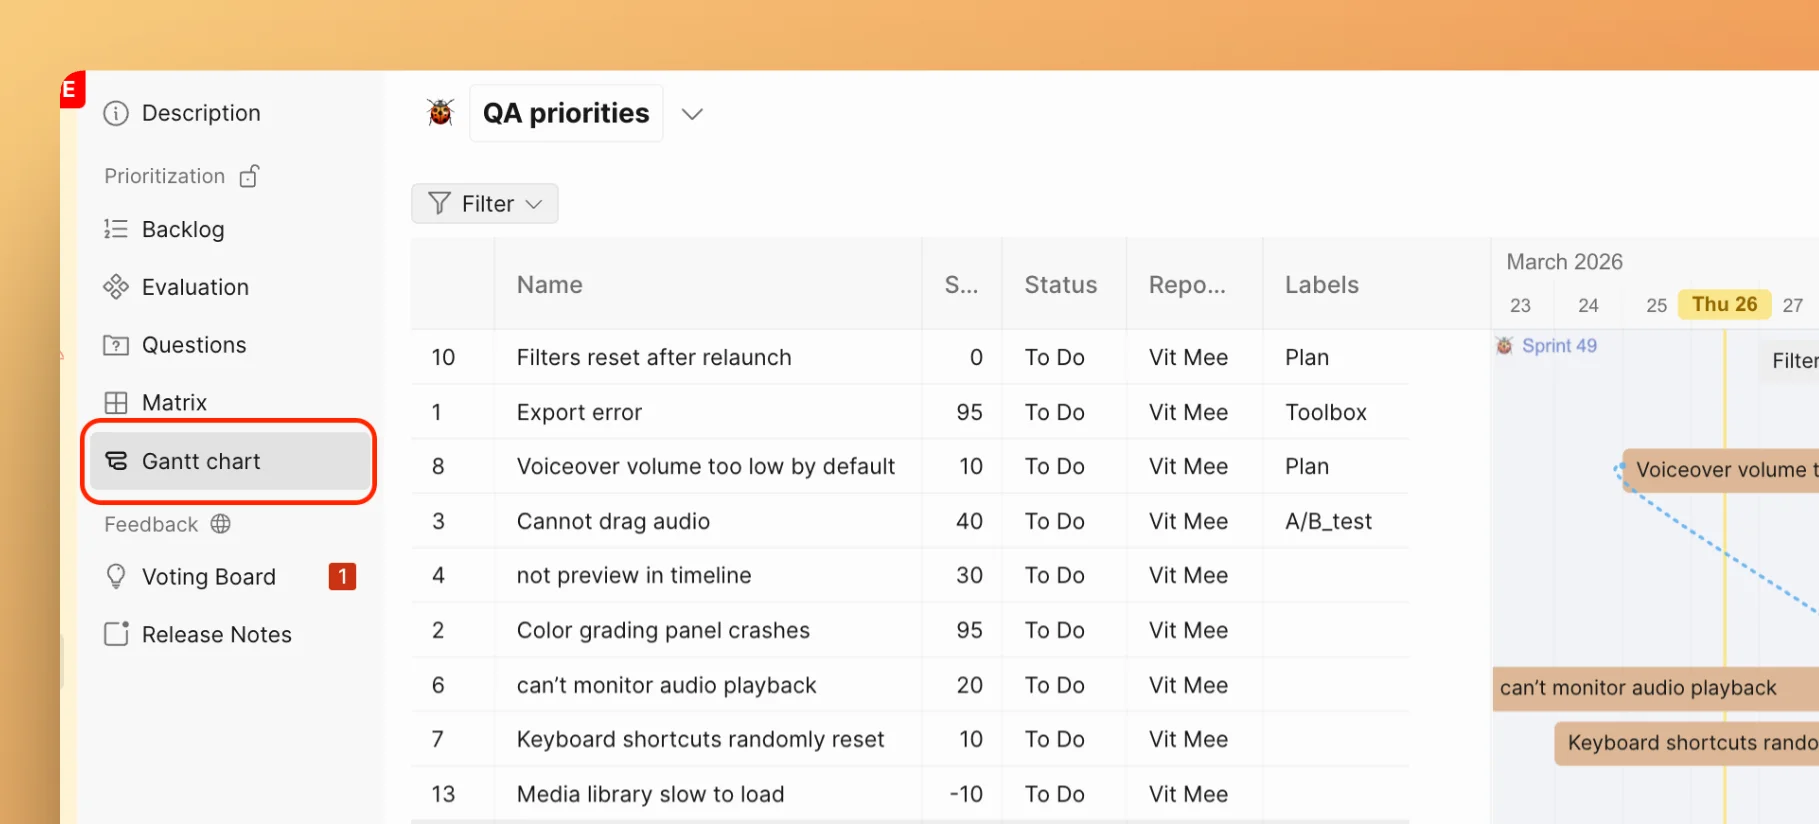
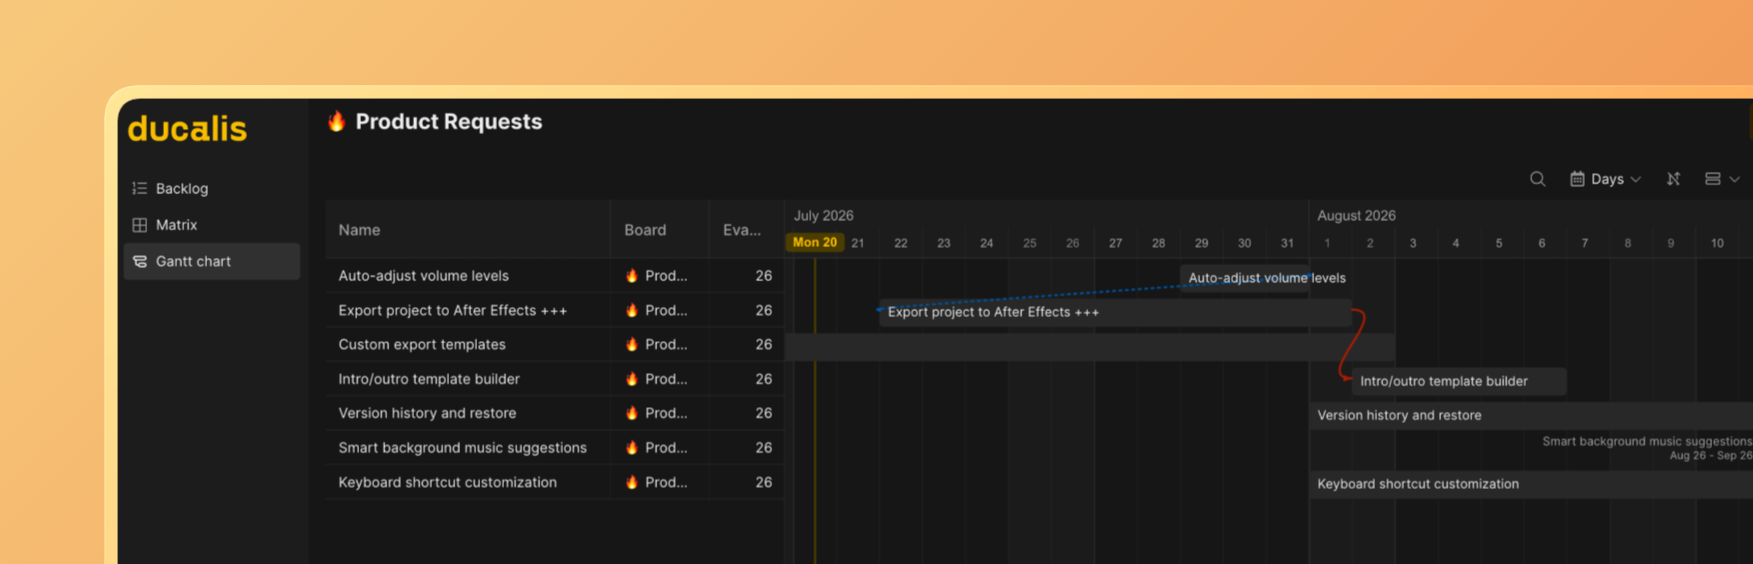
- Inside a Board — open any Board and select Gantt chart from the left sidebar. This Gantt shows tasks from that specific Board.
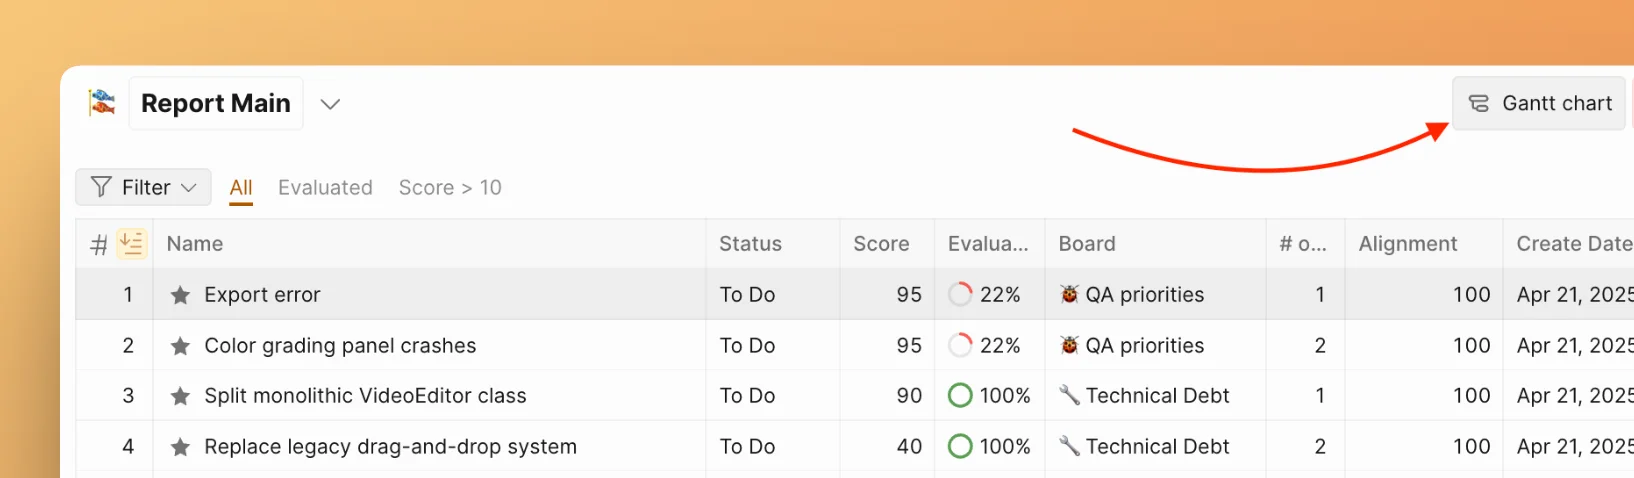
- Inside a Report — open a Report and select Gantt chart from the sidebar. This Gantt can show tasks from all Boards in the Report, enabling cross-team planning.
Board and Report Gantt charts are independent. Adding a task to a Board's Gantt chart does not add it to the Report's Gantt chart, and vice versa.
UI layout
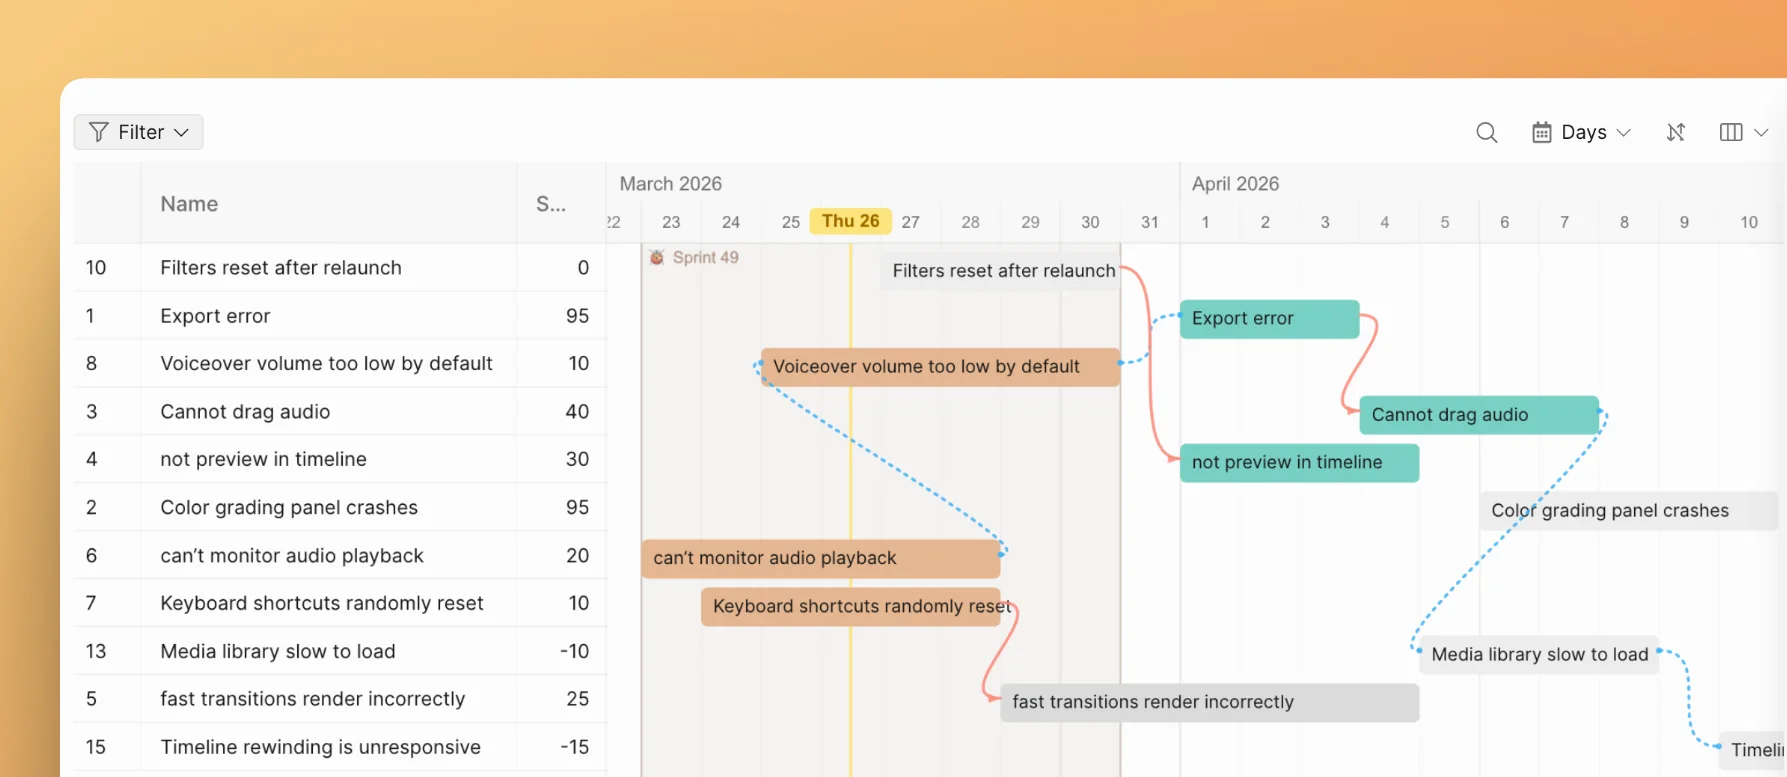
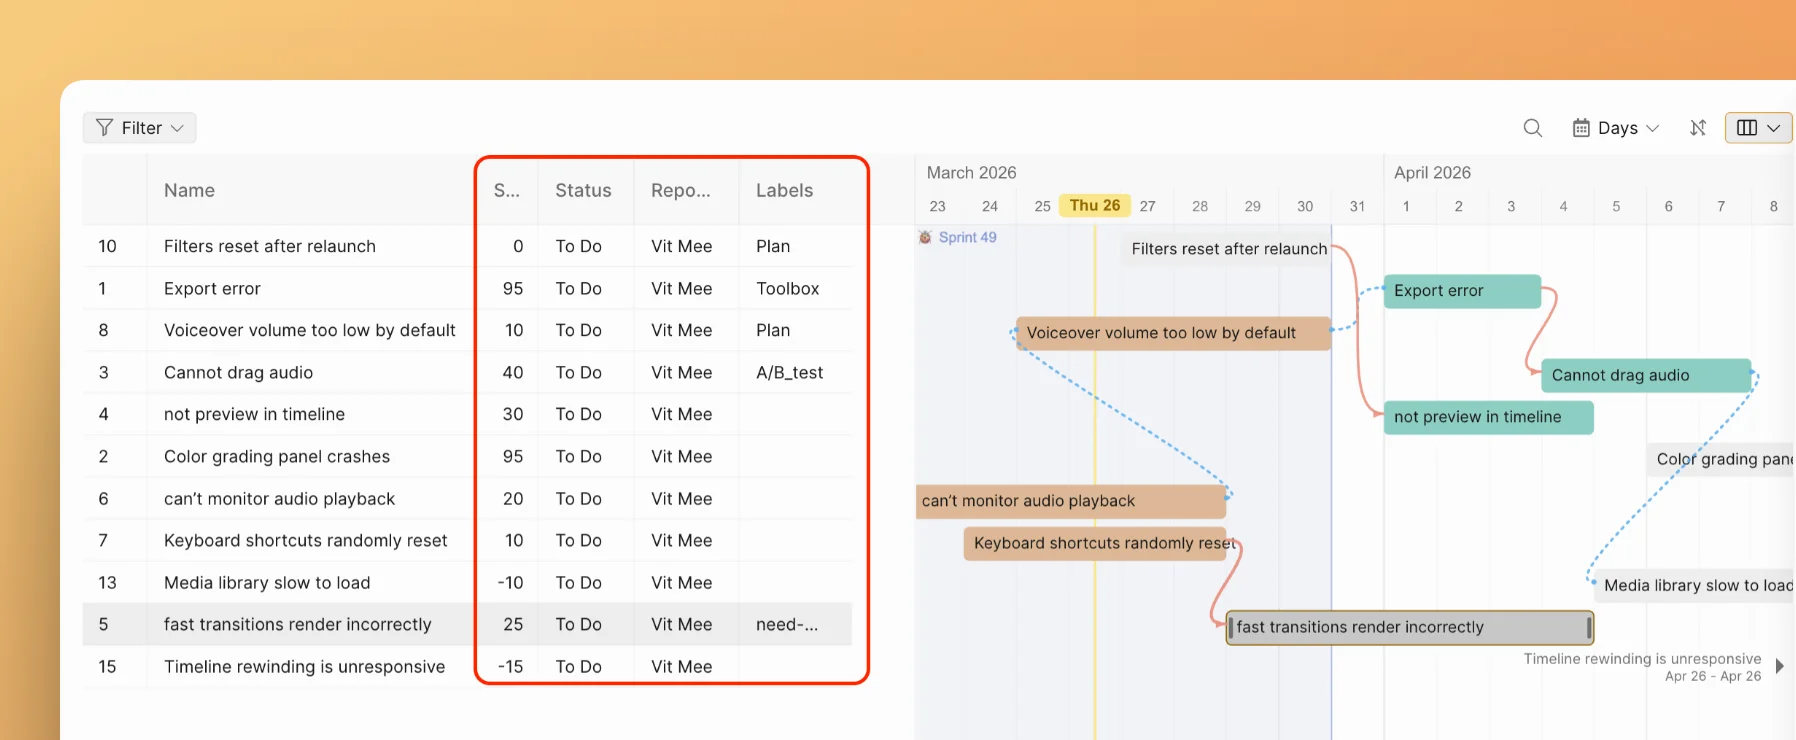
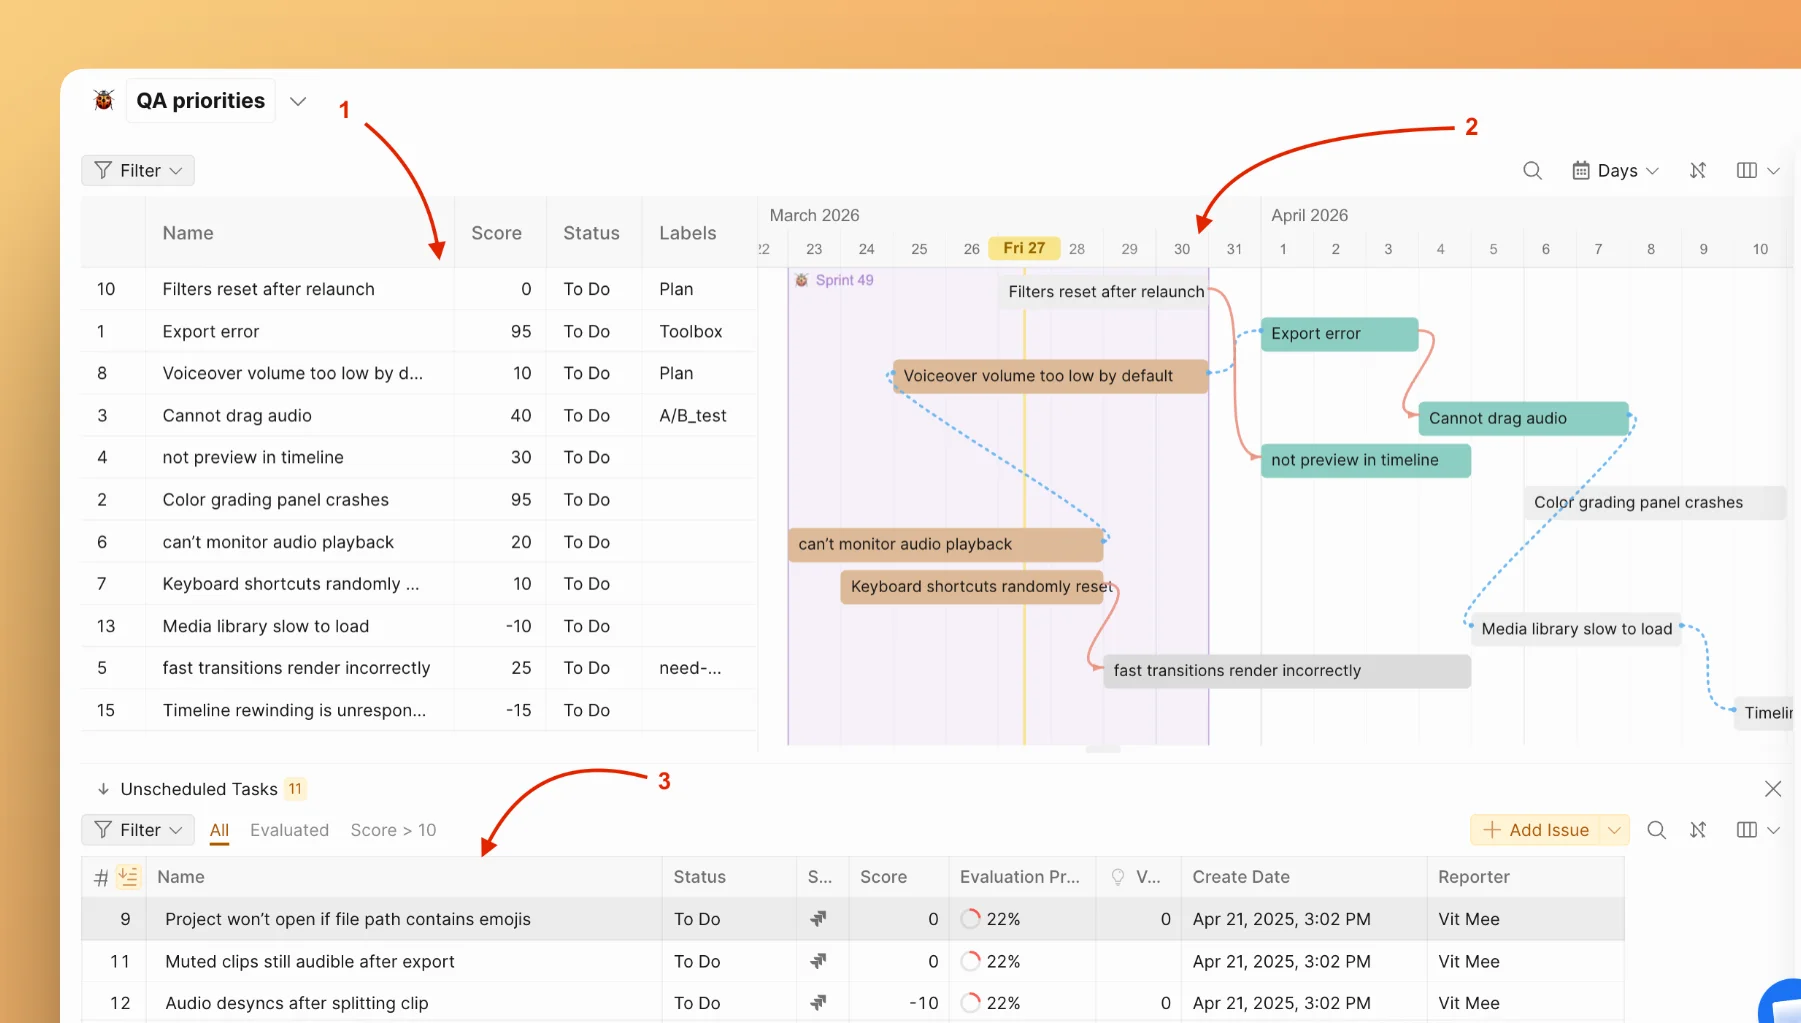
The Gantt chart combines a data table with a visual timeline:
- Table panel (left) — displays task data in columns. Shows Name and Score by default. You can add more columns like Assignee, Status, and Type.
- Timeline (right) — displays task bars on a calendar. Drag bars to reschedule, resize to change duration, and draw connections between tasks.
- Unscheduled Tasks panel (bottom) — lists all tasks not yet added to this Gantt chart, with a count badge. Drag tasks from here onto the timeline.
Share Gantt view
You can share a link to the Gantt chart with people who are not on the Board — for example, stakeholders or clients outside your Organization. They will be able to view the Gantt chart (along with the Backlog and Matrix pages) without needing an account.
Related articles
- Adding and scheduling tasks — Add tasks to the timeline, set dates, and create tasks on the fly
- Dependencies — Create links and scheduling constraints between tasks
- Organizing and navigating — Sort, group, filter, and zoom the timeline
- Task tracker sync — How the Gantt chart works with synced tasks and what does not sync yet
- Gantt chart in Reports — Combine multiple Boards into one timeline