Gantt Chart in Reports
Reports combine multiple Boards into a single view. Each Report has its own Gantt chart, which lets you plan across different backlogs on one timeline.
When to use the Report Gantt chart
The Board-level Gantt chart works well when all your tasks come from one Board. But teams often split work across several Boards — for example:
- Bugs Board — prioritized bug reports
- Features Board — new feature requests from the Voting Board
- Tech Debt Board — internal improvements and refactoring
Each Board has its own backlog, prioritization criteria, and scores. When it is time to plan a sprint or quarter, you need to see all of these together.
Use case: Create a Report that combines all your Boards. Open the Report's Gantt chart, and the Unscheduled Tasks panel shows tasks from every Board. Drag tasks onto the timeline to build a unified plan. Then group by Board, by Assignee, or by Status to see workload distribution.
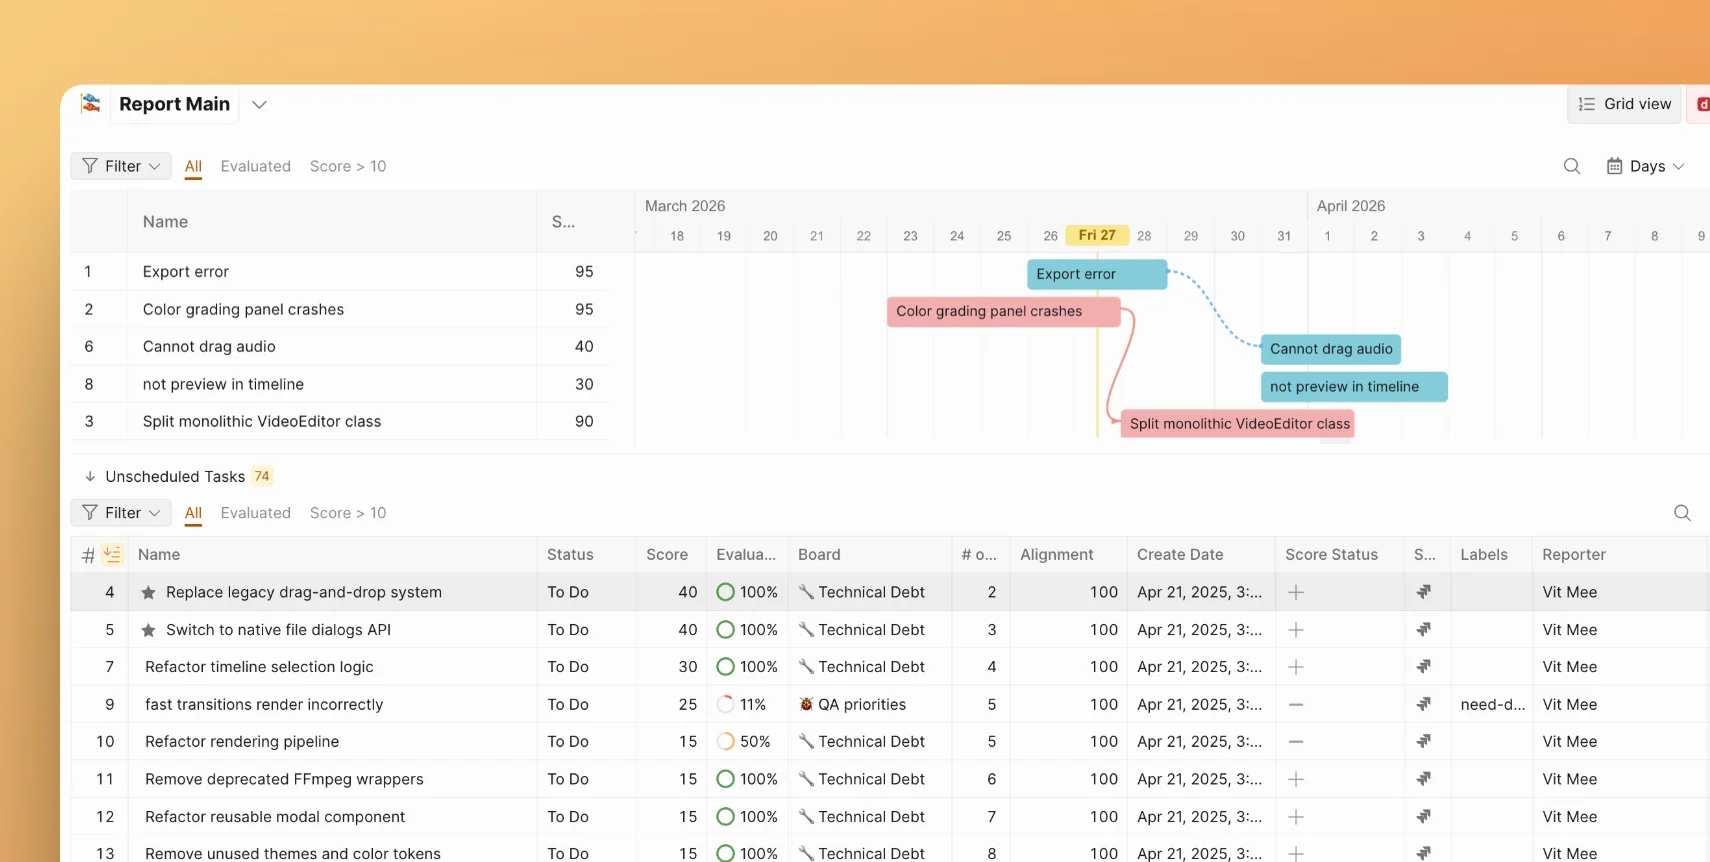
Access the Report Gantt chart
-
Open a Report from the left sidebar.
-
Select Gantt chart from the Report's navigation menu.
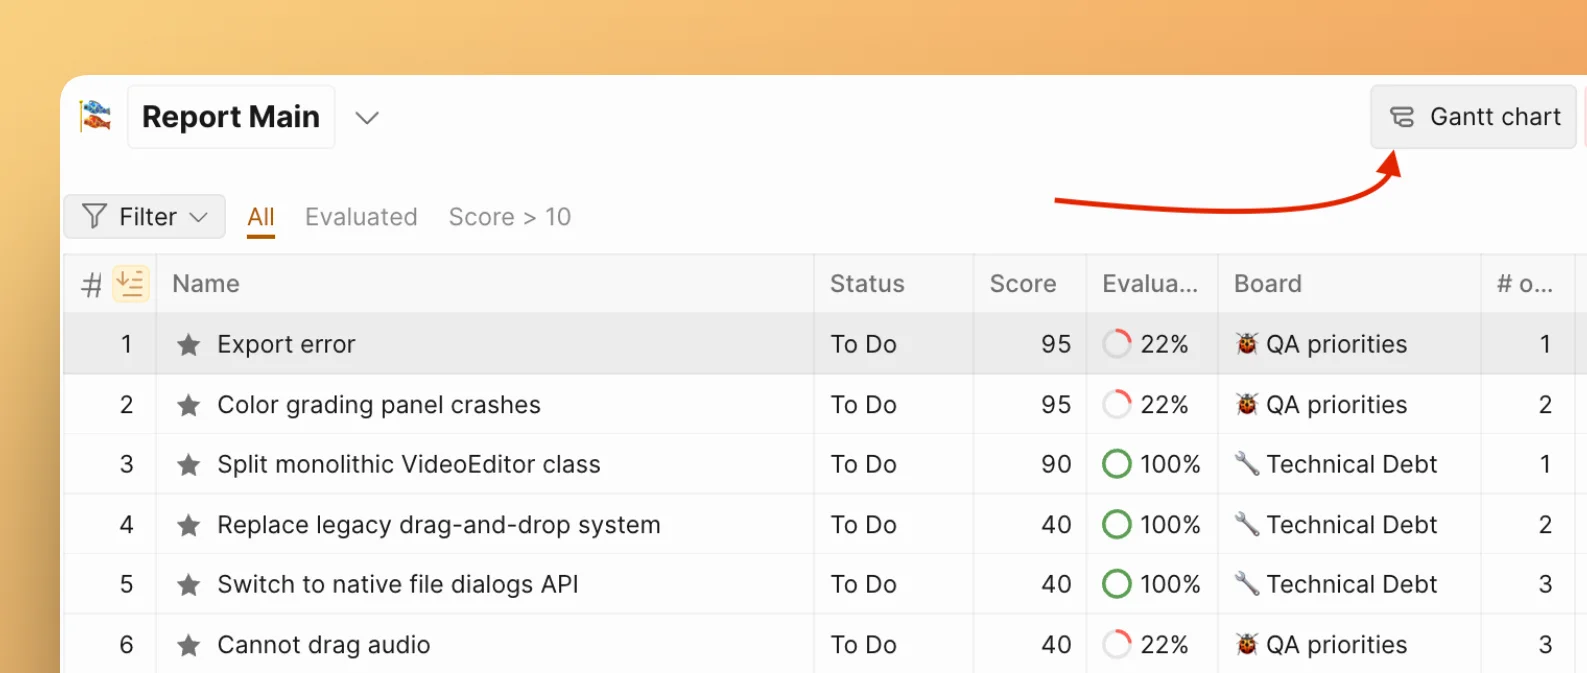
Board Gantt vs. Report Gantt
| Aspect | Board Gantt | Report Gantt |
|---|---|---|
| Scope | Tasks from one Board | Tasks from all Boards in the Report |
| Independence | Adding a task here does not add it to any Report Gantt | Adding a task here does not add it to any Board Gantt |
| Grouping | By Assignee, Status, Type, Reporter | Same + by Board |
| Use case | Sprint planning for a single team | Cross-team quarterly or roadmap planning |
Tasks are added to each Gantt chart independently. Scheduling a task on a Board's Gantt chart does not automatically add it to the Report's Gantt chart. This gives you flexibility — for example, a detailed sprint plan per Board and a high-level roadmap in the Report.
Cross-board planning
All standard Gantt features work across Boards in a Report:
- Drag tasks from different Boards onto the same timeline.
- Create dependencies between tasks from different Boards.
- Group by Assignee to see who is overloaded.
- Filter by Board, status, or assignee to focus on specific areas.
Related articles
- Gantt Chart Overview — How the Gantt chart fits into the prioritization workflow
- Reports — Create and manage aggregated Report Boards