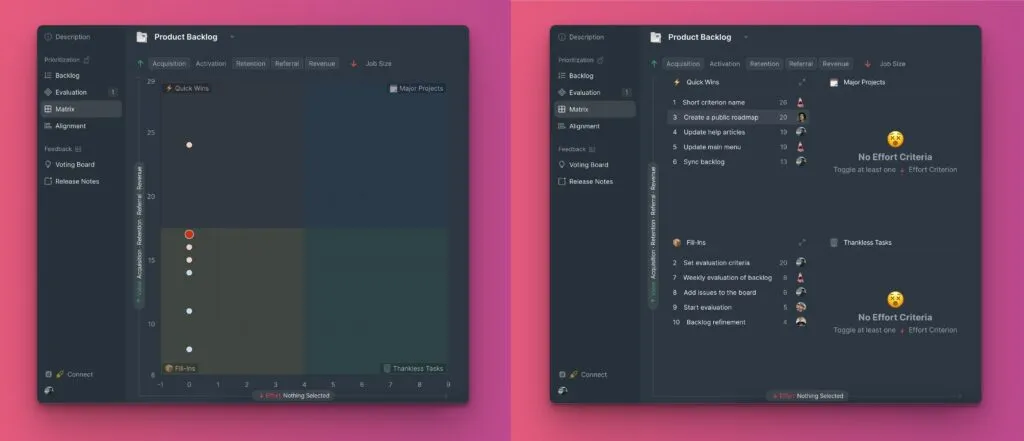
Matrix page
The Matrix page displays your Issues in a Value vs Effort prioritization grid, helping you identify top priorities using the Eisenhower method. Value measures benefit (what you gain), while Effort measures cost (what it takes).
Start by evaluating your backlog with your teammates using Value criteria (like Revenue or Activation) and Effort criteria (like Development time or UX complexity).

Your results appear on the Matrix diagram, with Value on the y-axis and Effort on the x-axis.
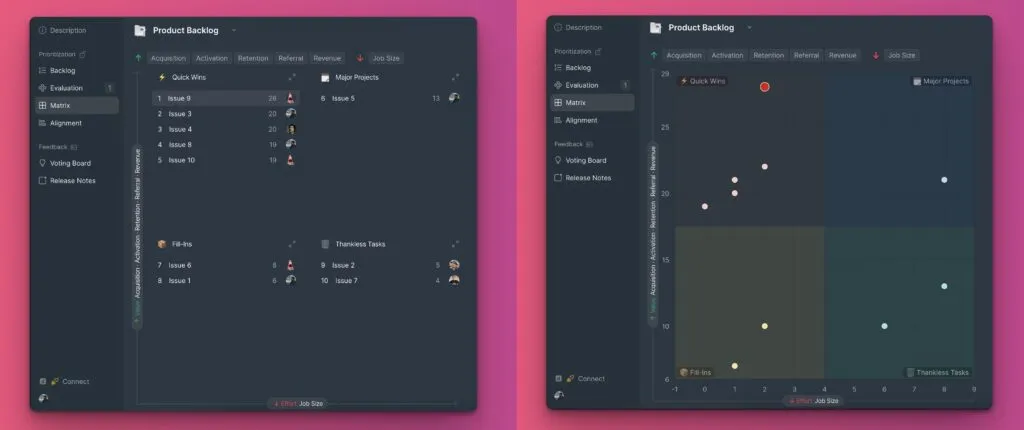
Value and Effort are Criterion properties called "Impact." Assign Impact when you create a Criterion in Criteria settings.
The Matrix uses a different formula than the board formula used on the Backlog page. Criterion weights also don't affect Matrix calculations.
Priority quadrants
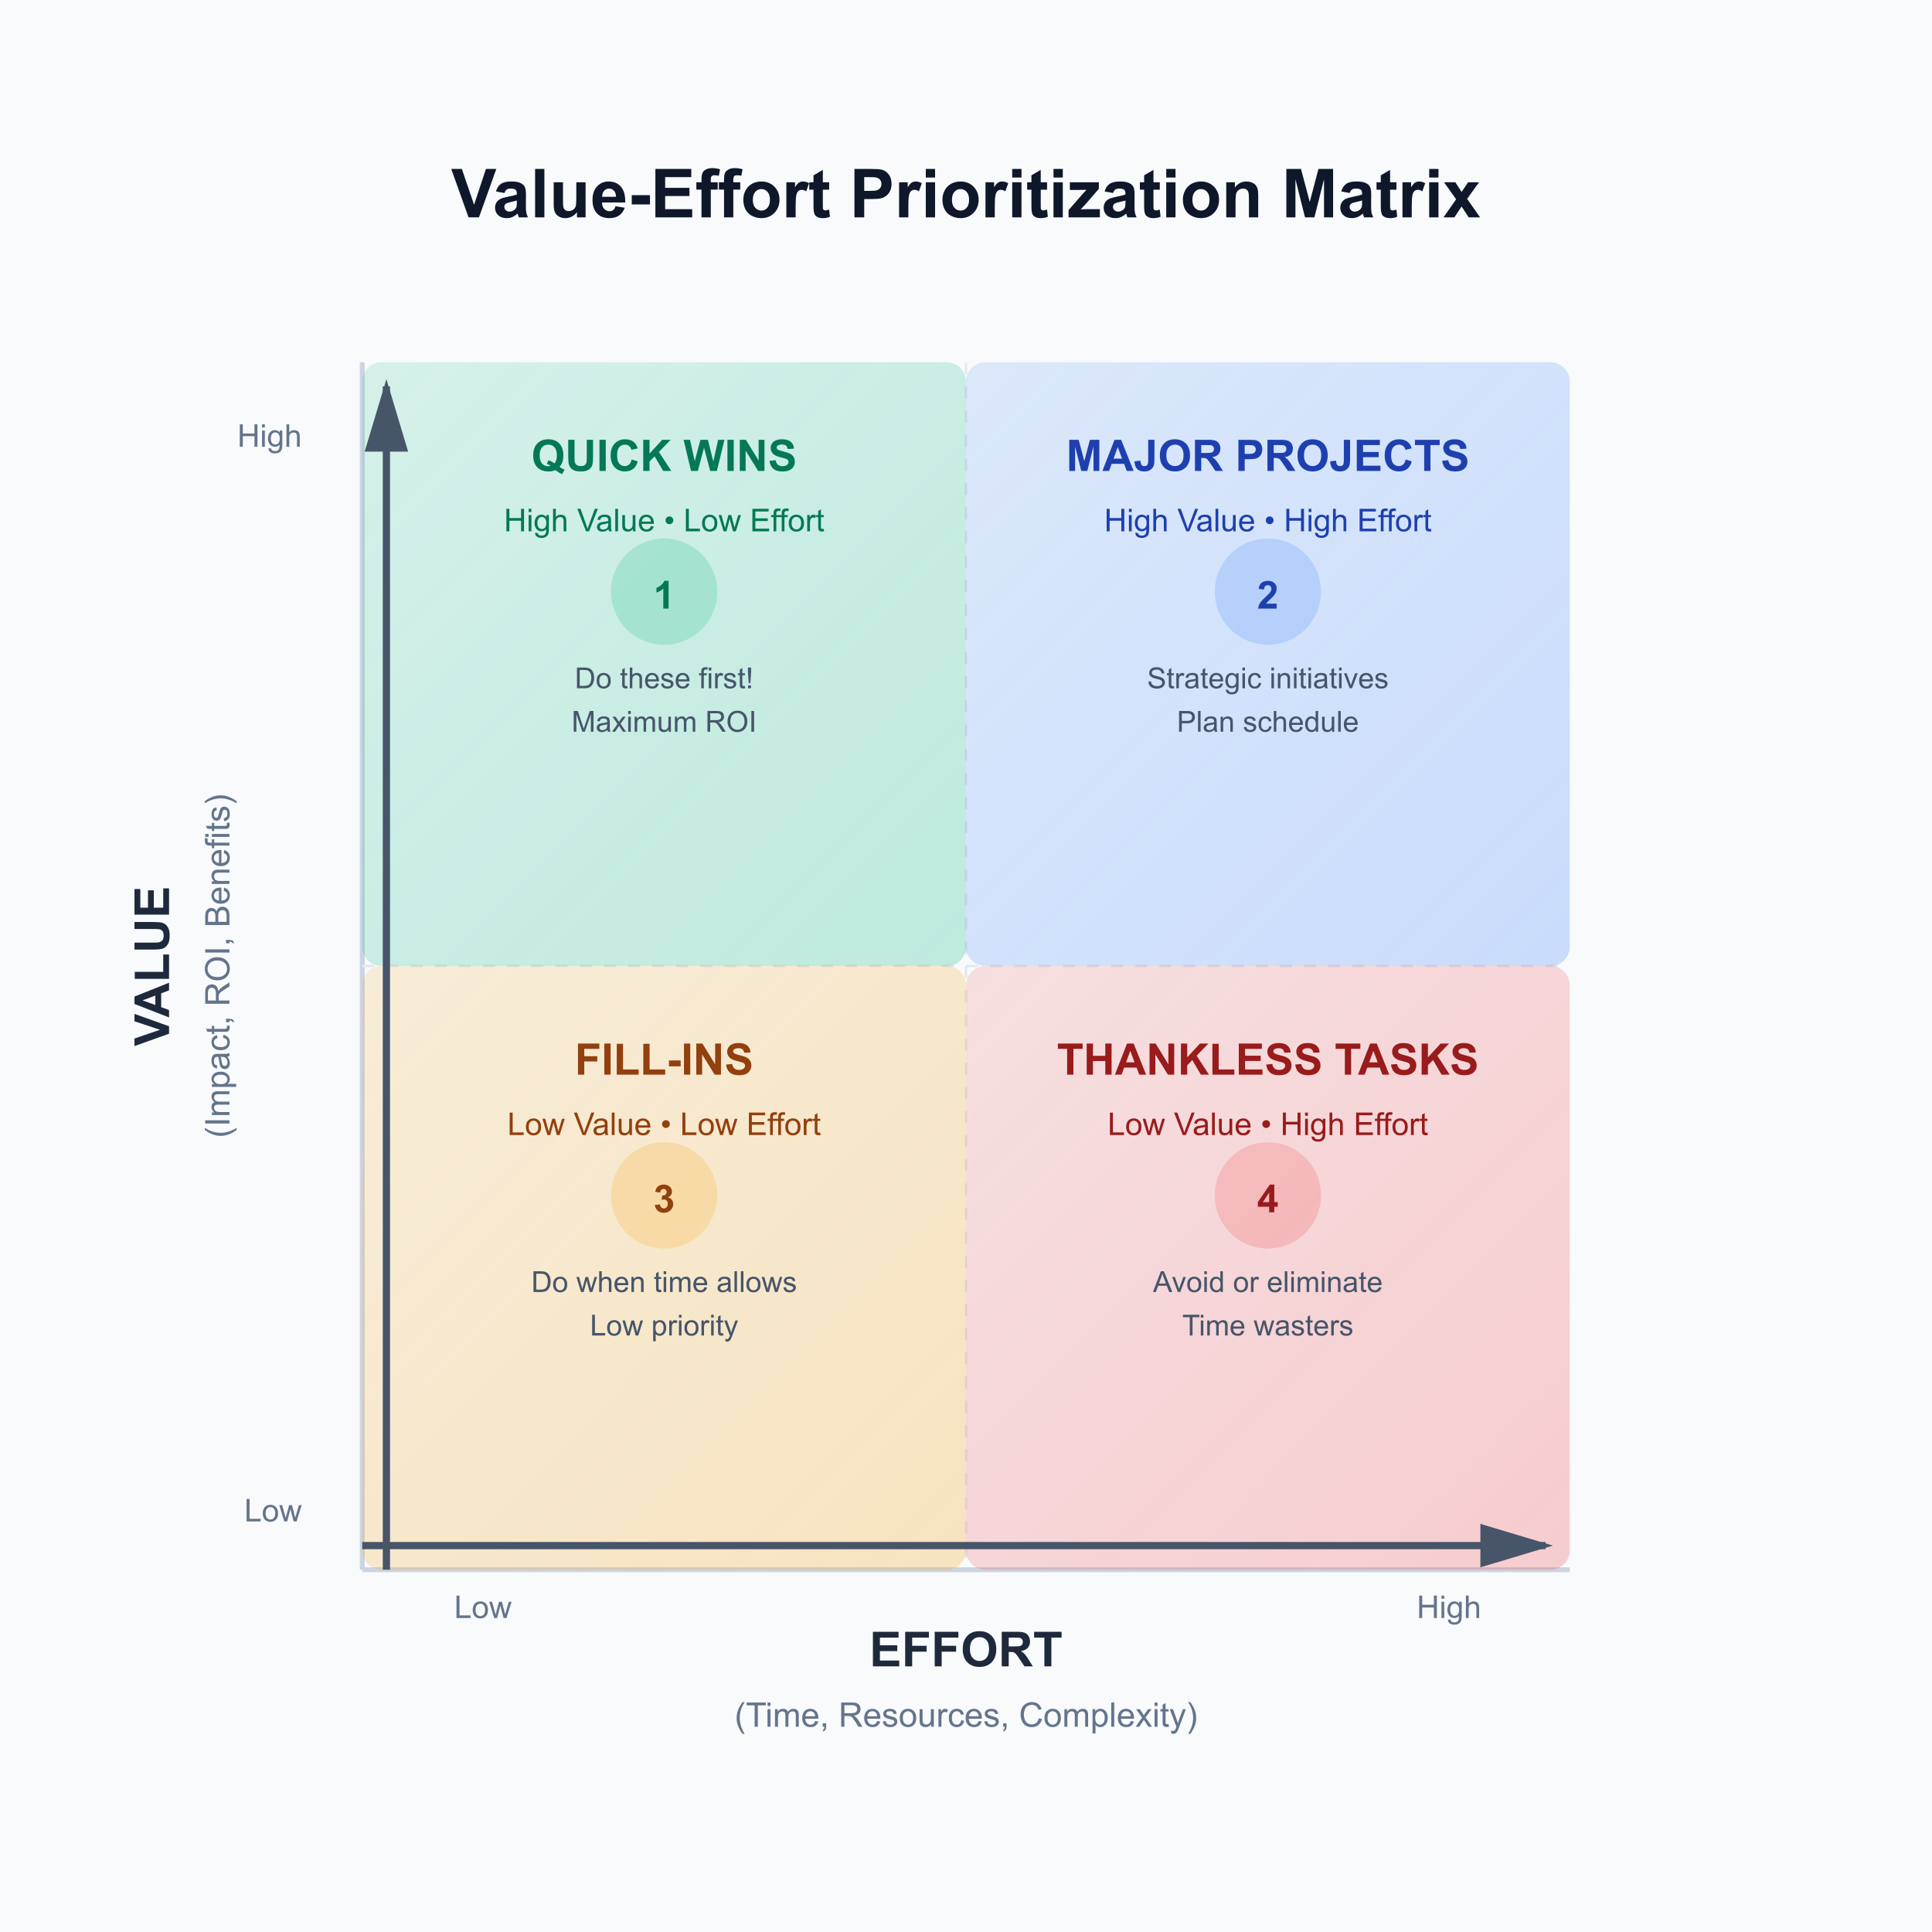
The Matrix divides into four quadrants that categorize Issues by priority:
-
First quadrant — High Value, Low Effort: Issues that deliver high ROI with minimal resources and time.
-
Second quadrant — High Value, High Effort: Issues that deliver high ROI but require significant resources and time.
-
Third quadrant — Low Value, Low Effort: Issues with low ROI that require minimal resources and time.
-
Fourth quadrant — Low Value, High Effort: Issues with low ROI that require significant resources and time.
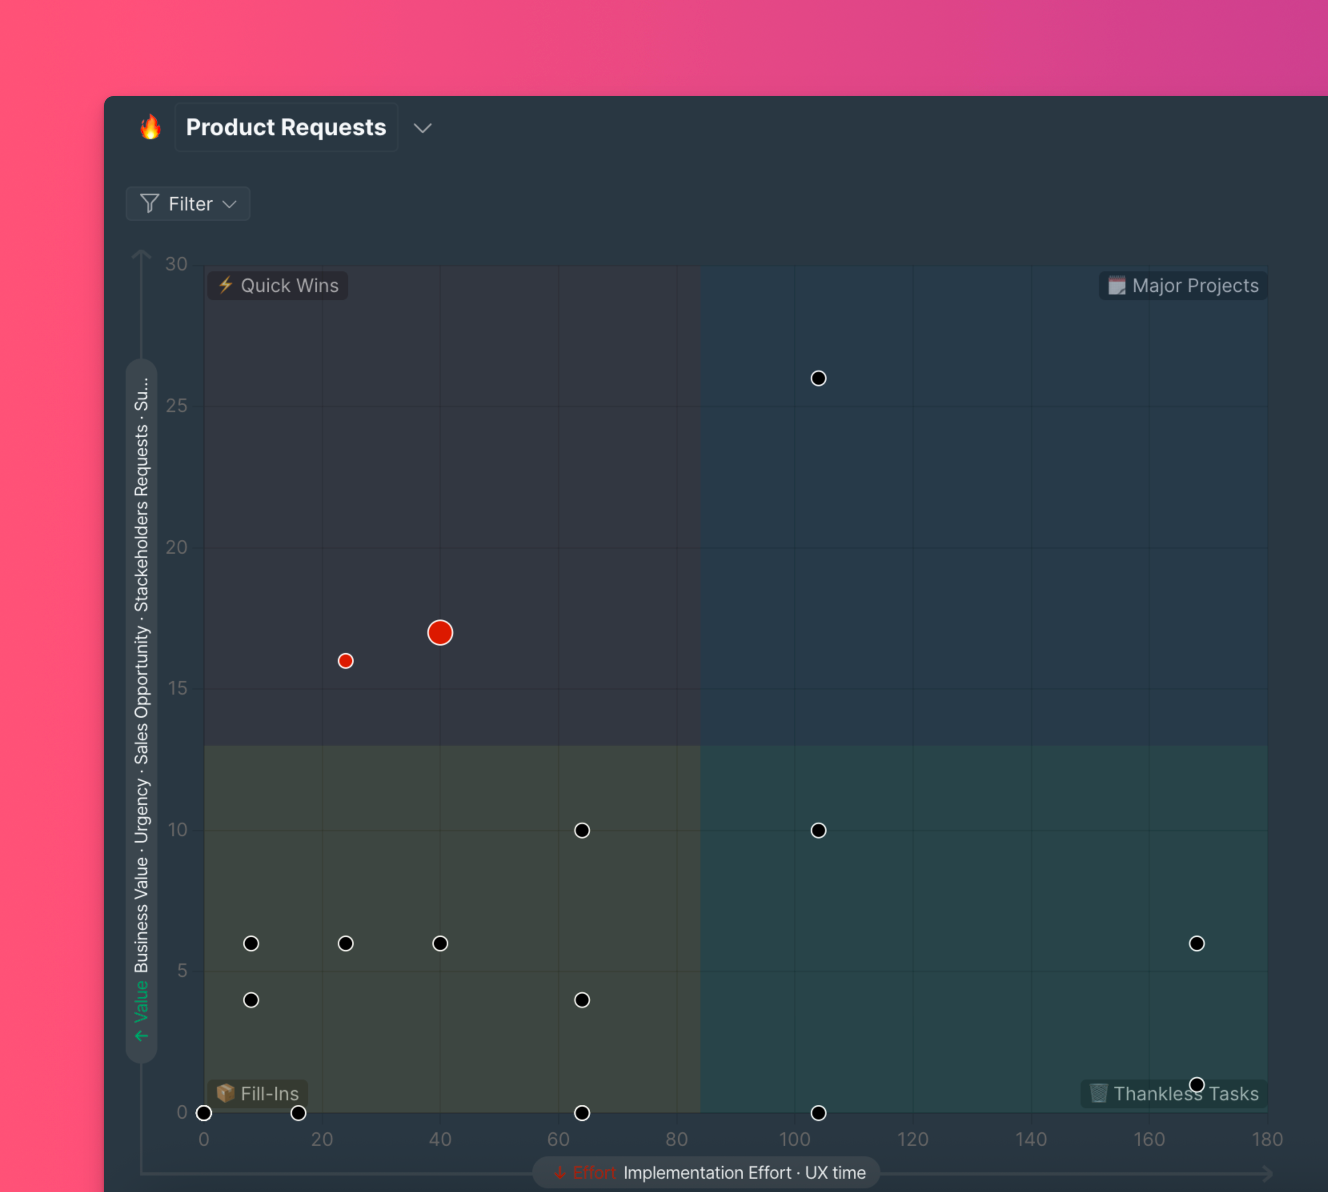
You can edit the default quadrant names.
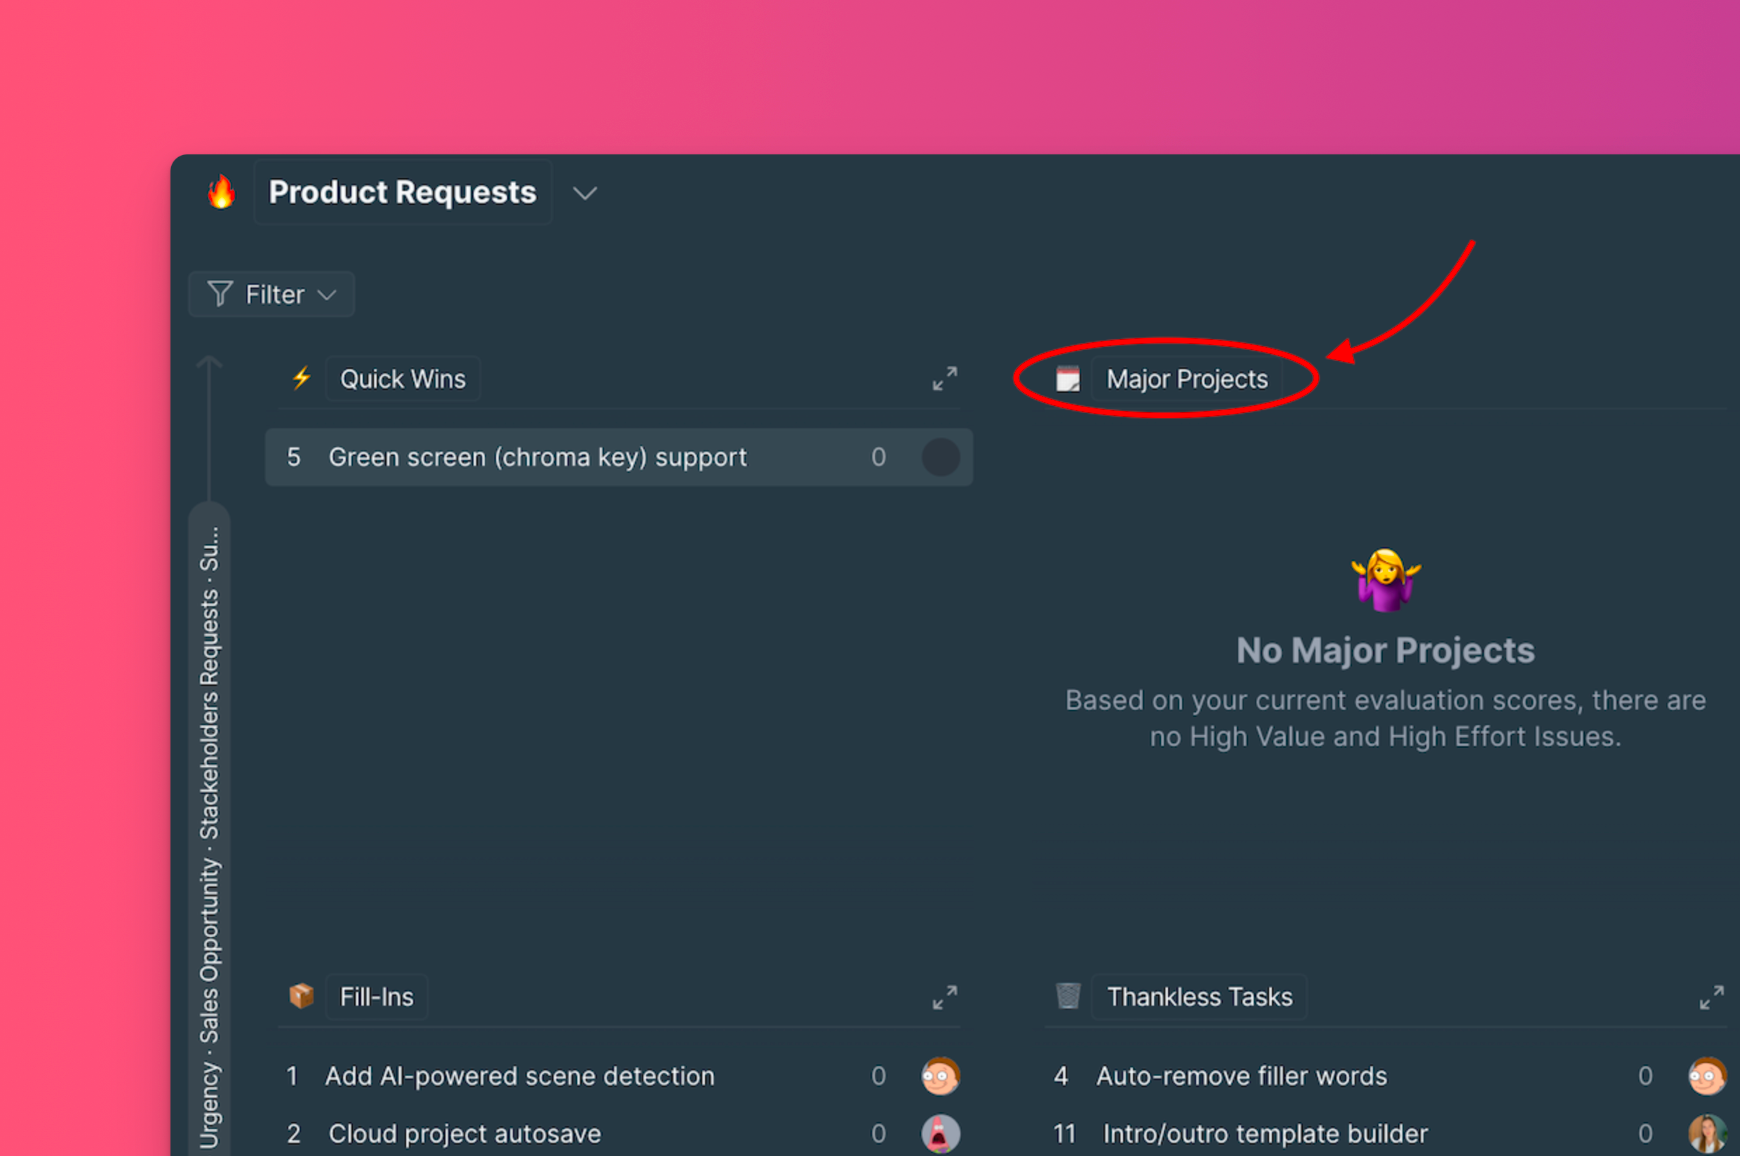
Views
The Matrix offers two visualization modes:
List view
Issues appear grouped by quadrant in a list format, ordered by priority within each quadrant.
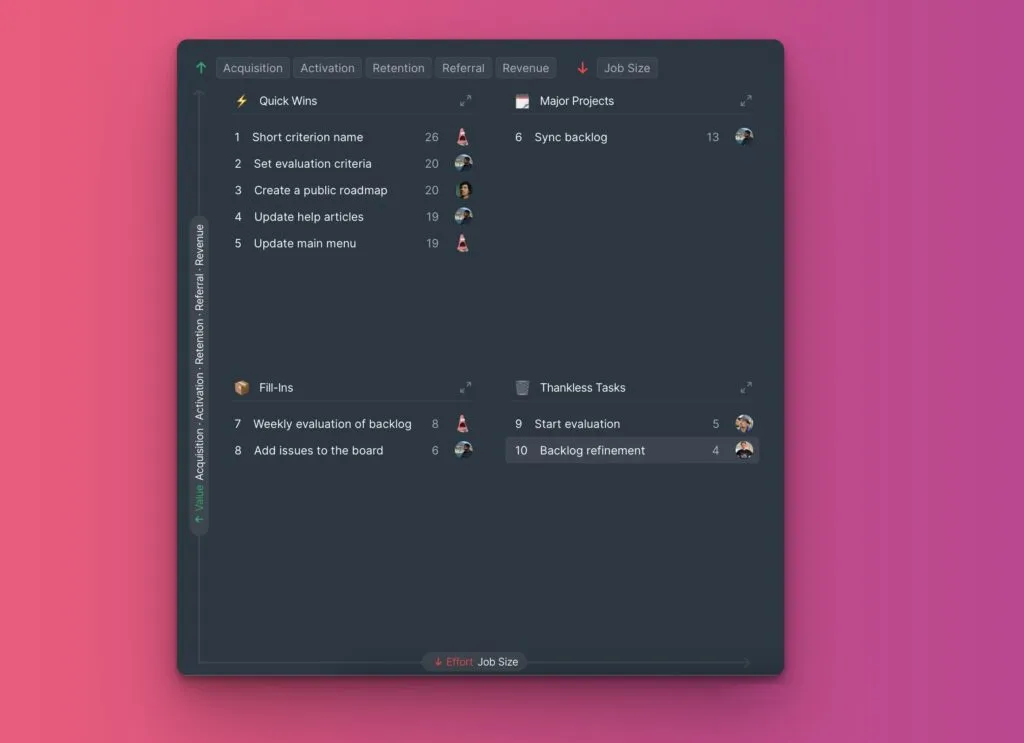
Expand a quadrant to see all Issues within it.

Click an Issue to open its card and view details, including Value and Effort scores.

Chart view
Issues appear as color-coded bubbles spread across the Matrix diagram, showing exactly where each Issue falls on the grid.
Each quadrant has a distinct color:
- Red — High Value, Low Effort
- Blue — High Value, High Effort
- Yellow — Low Value, Low Effort
- Green — Low Value, High Effort
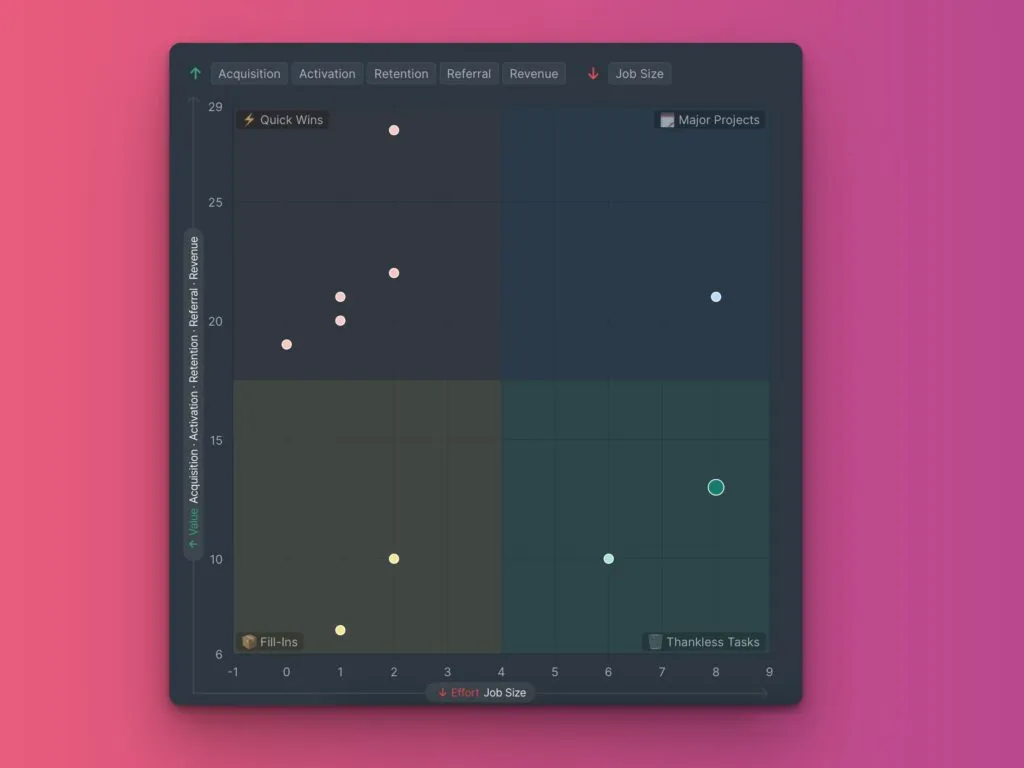
Hover over a bubble to see a summary of the Issue(s) at that position.

Click a bubble to open the Issue card and view details, including Value and Effort scores.

Switch views
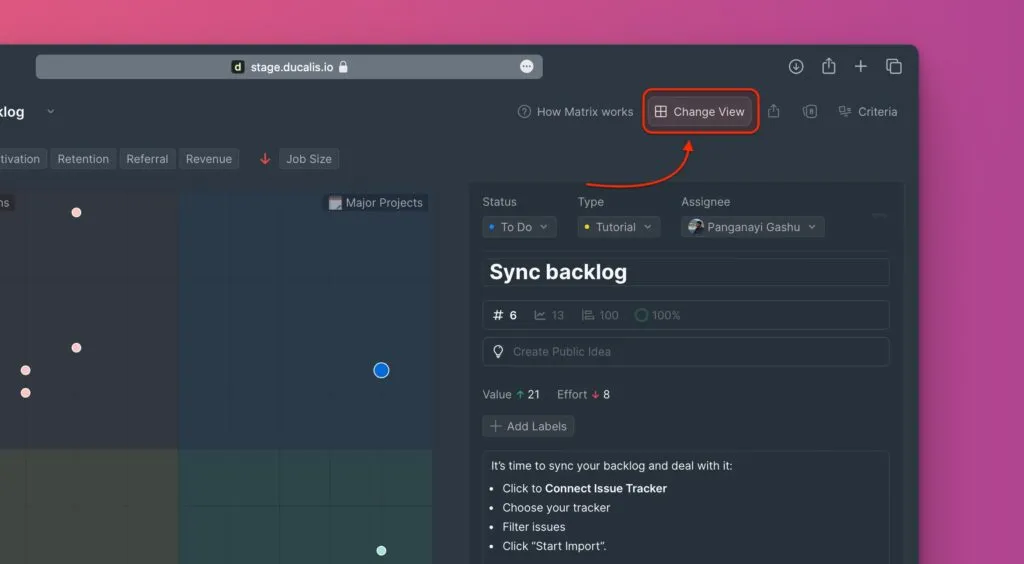
Click Change View to switch between List and Chart views.
Prioritization framework
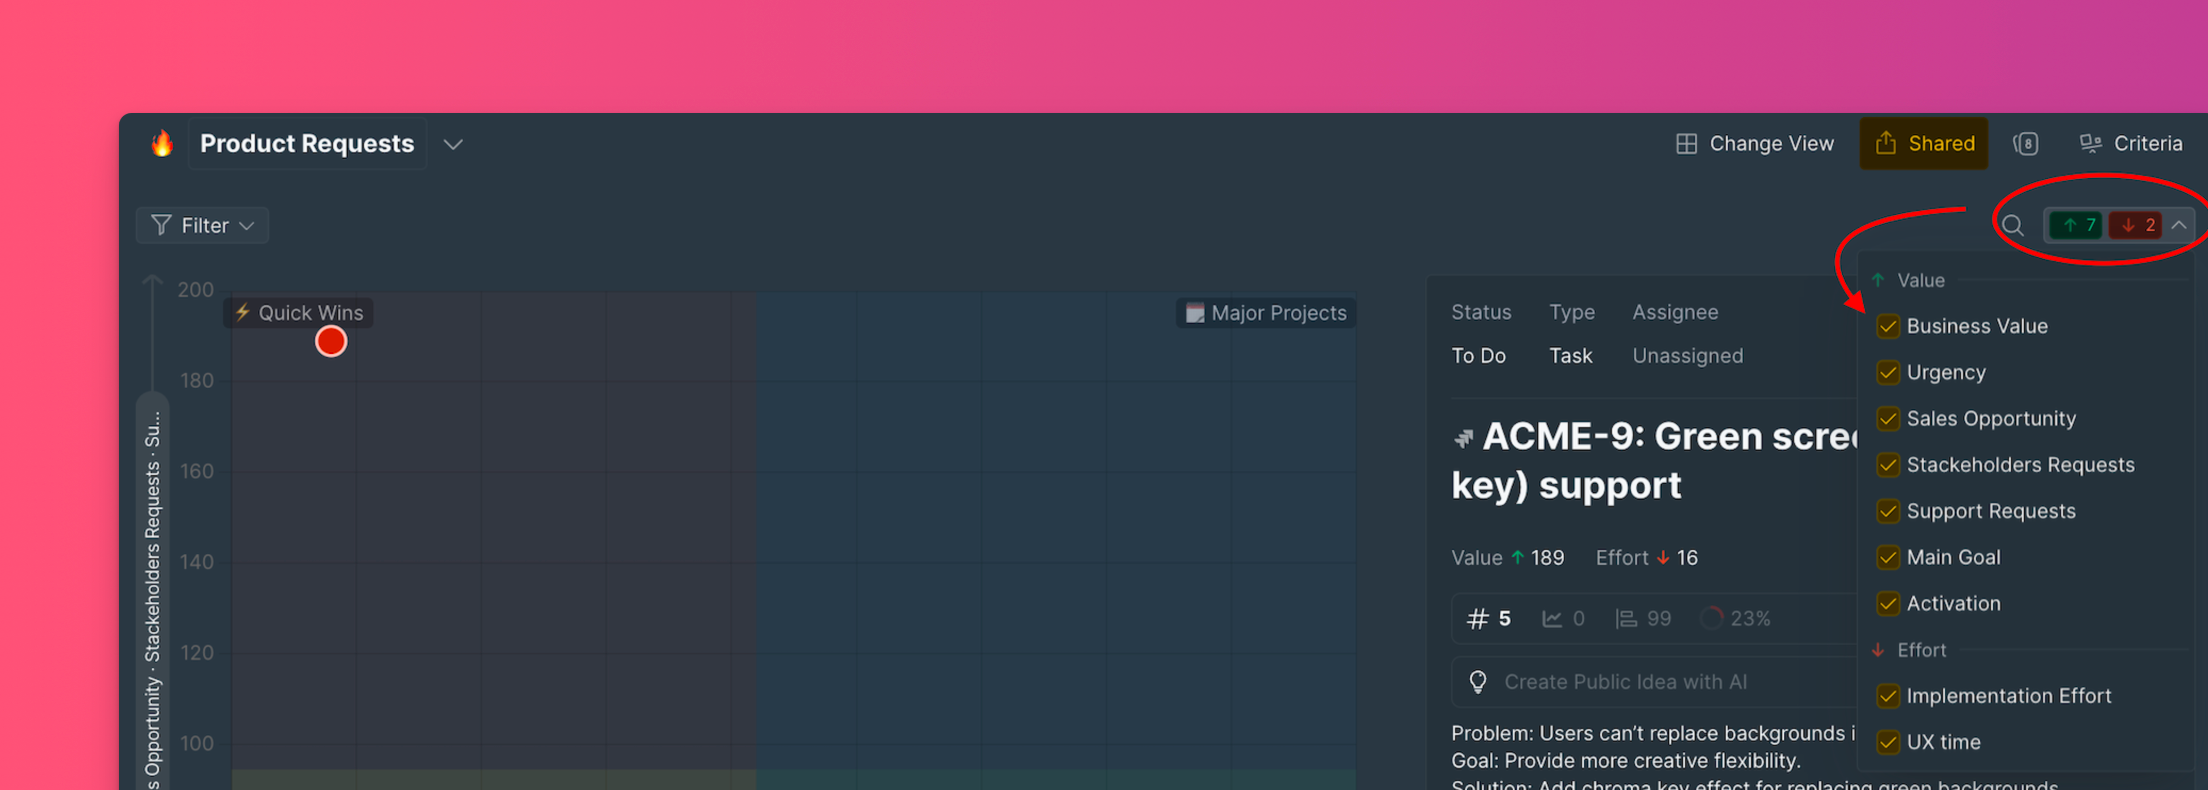
Your prioritization framework Criteria appear upper right corner.
Enable or disable Criteria
Choose which Criteria to include in Value and Effort calculations based on your current sprint goals.
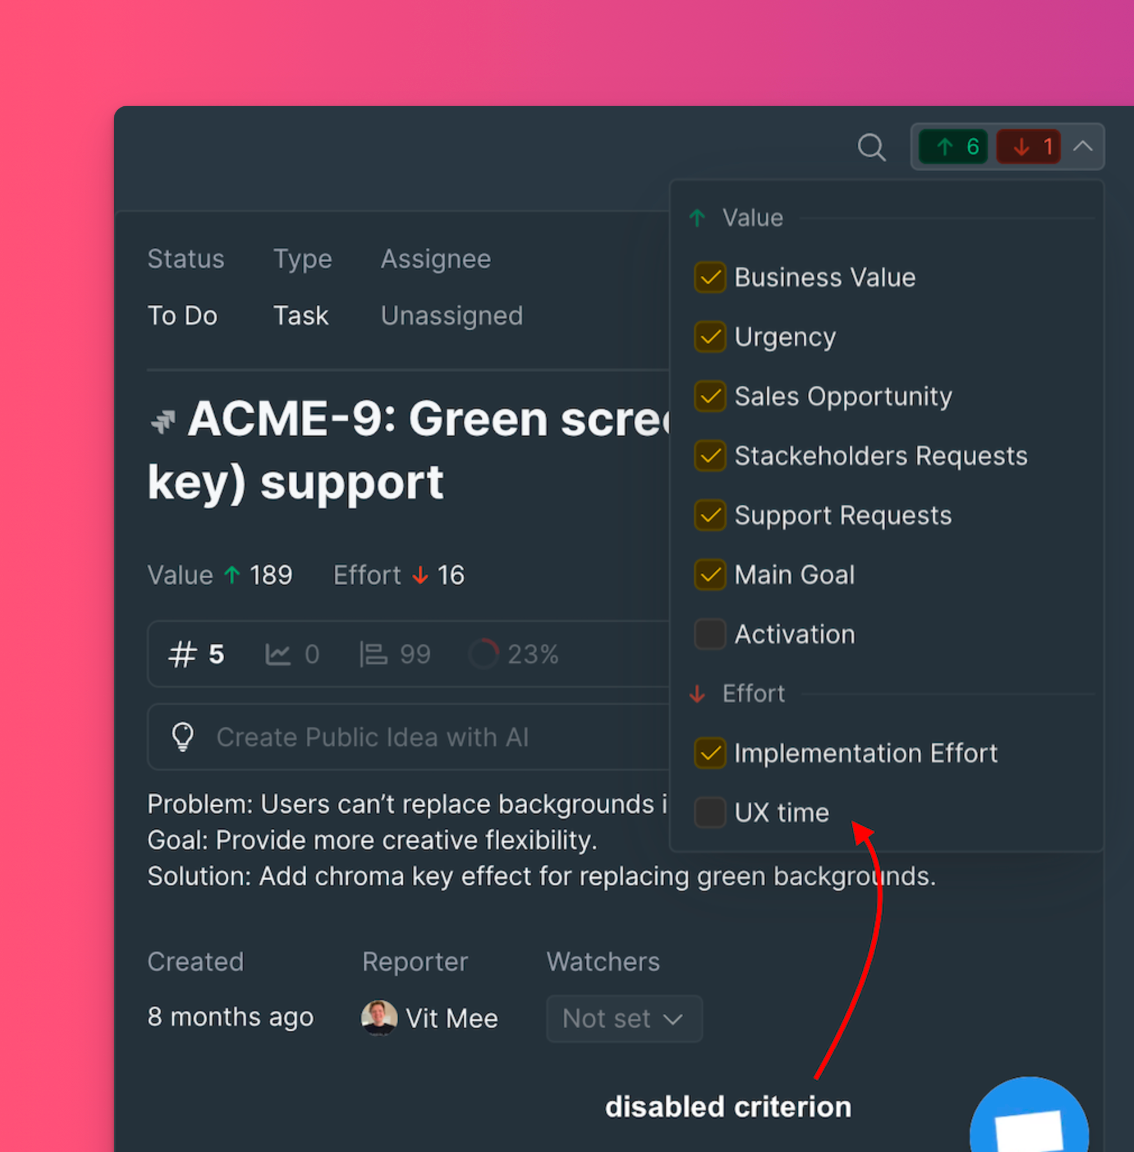
Disable a Criterion to exclude it from calculations. Enable it to include it again.
In this example, the "Activation" and "UX time" Criteria are disabled because they are not important for the current sprint. Disabling these Criteria changes all Issue scores, redistributing Issues across the Matrix.
Keep at least one Value Criterion and one Effort Criterion enabled for accurate prioritization results and balanced Issue distribution across the Matrix.