Alignment
Alignment reports show where your team agrees or disagrees on issue priorities. Use these reports to identify scoring conflicts and focus discussions on issues that need clarification.
What Alignment measures:
- Score variation between team members on the same criterion
- Disagreement patterns across criteria and evaluators
- Areas requiring team discussion before finalizing priorities
Ducalis compares scores assigned to each criterion and measures the scatter. Score variation appears as a percentage—lower percentages indicate higher disagreement.
Alignment grading scales
Alignment grading scales are separate for each report. Changing the scale in one report doesn't affect the other report.
0 to 35 percent – Very low alignment (red). The team's opinions are too contrasting. Discuss the issue or the criterion before proceeding.
35 to 50 percent – Medium alignment (orange). Consider discussing the issue, but the level is acceptable.
50 to 100 percent – High alignment (gray). The team agrees on the issue. Focus on other problems.
Available reports
There are 2 alignment reports:
-
Criteria Alignment – View score variation by criterion for each issue.
-
Users Alignment – View score variation by user for each issue.
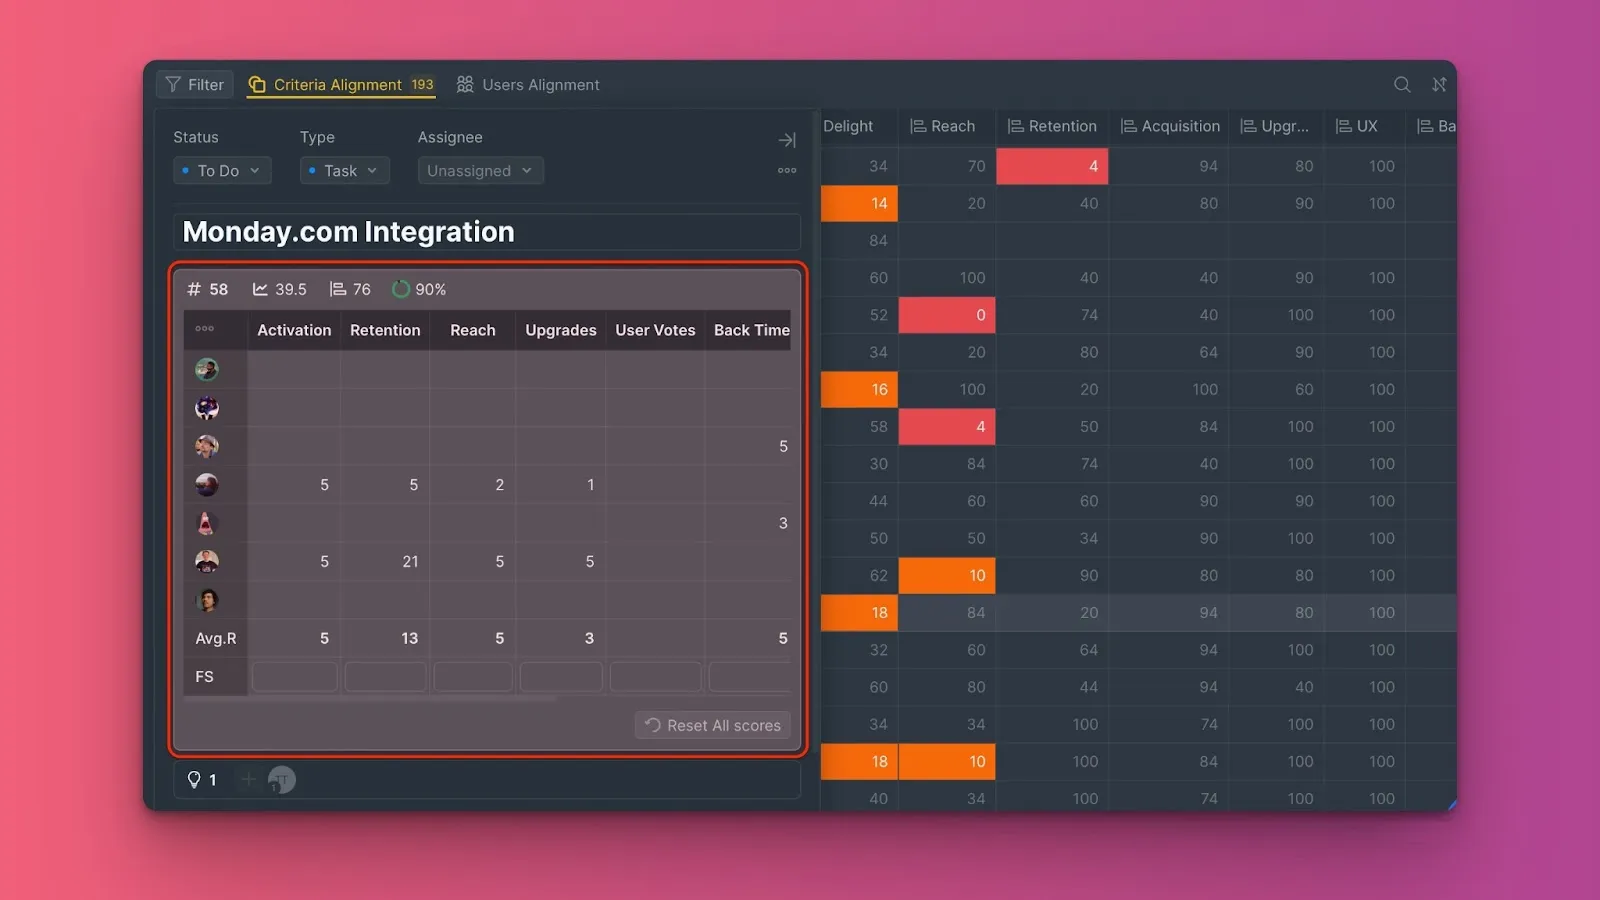
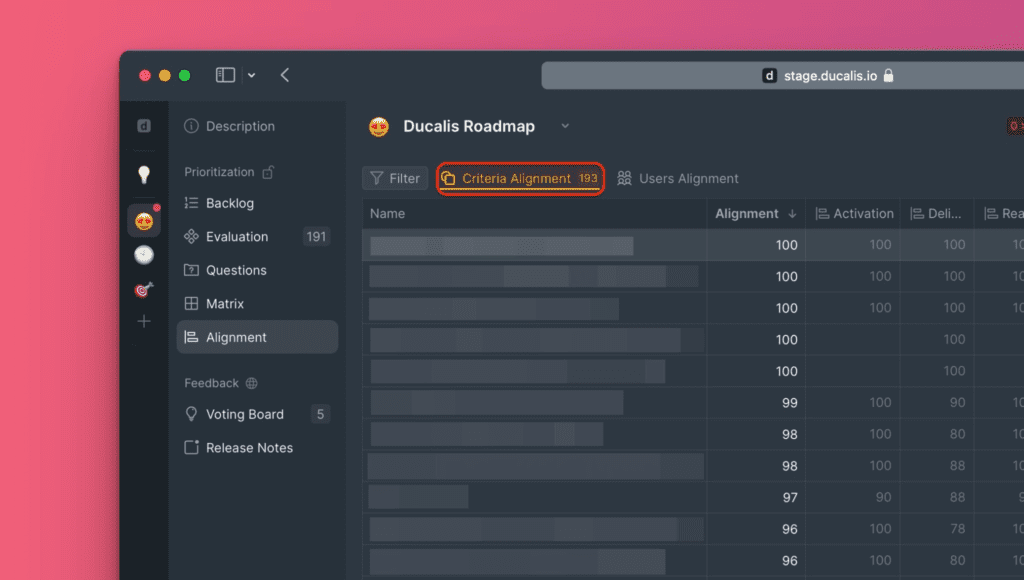
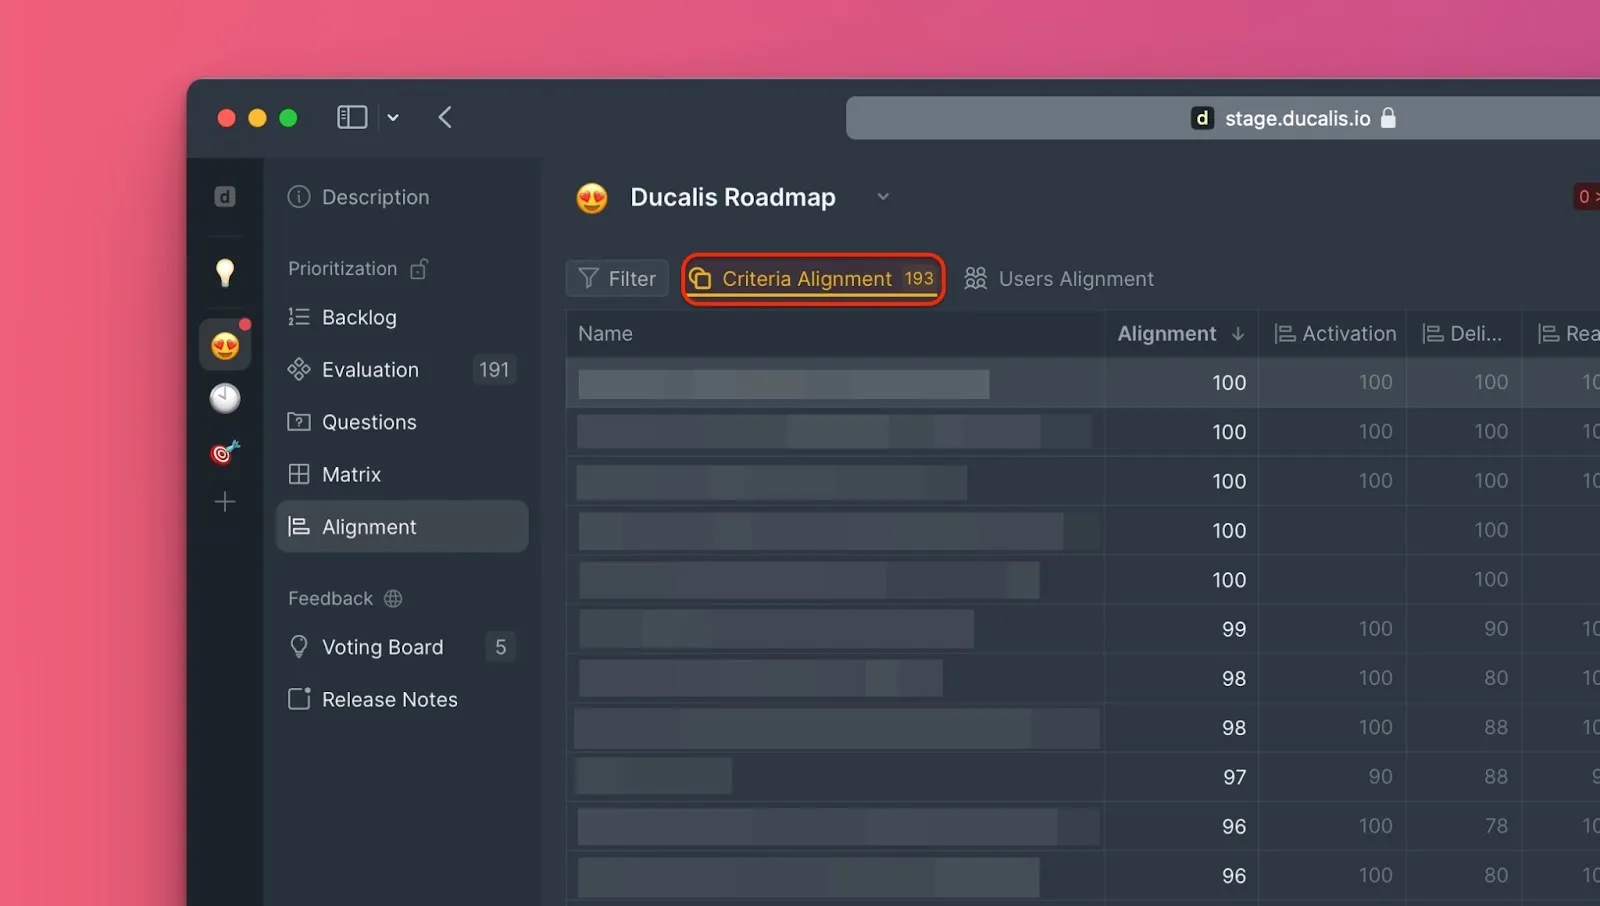
Criteria Alignment report
View how evaluation results vary for each issue, criterion by criterion.
-
Click Criteria Alignment.
-
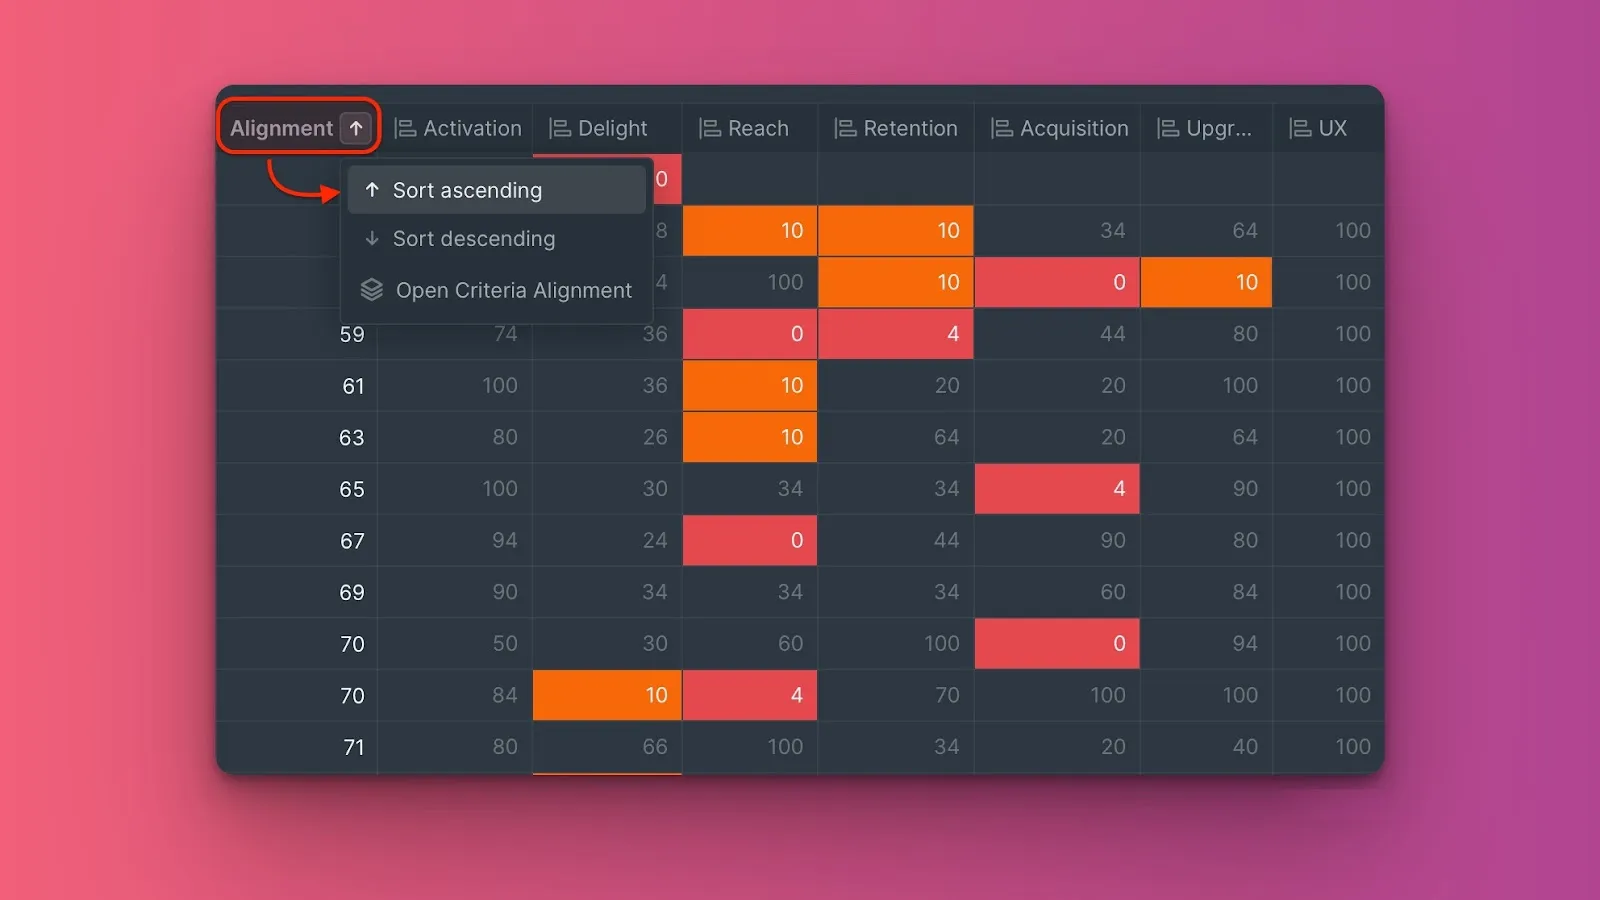
Sort issues by alignment to see the least aligned issues at the top (ascending order).
-
Hover over the alignment percentage at the intersection of an issue and a criterion to see individual scores from each evaluator.

Orange and red cells indicate significant score differences between evaluators. Discuss these issues with your team to understand the disagreement.
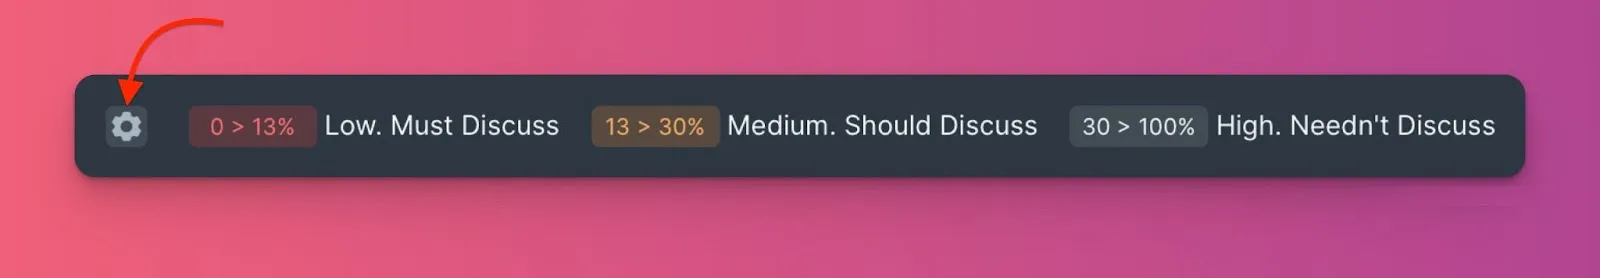
Customize the alignment scale
-
Click the cogwheel icon.
-
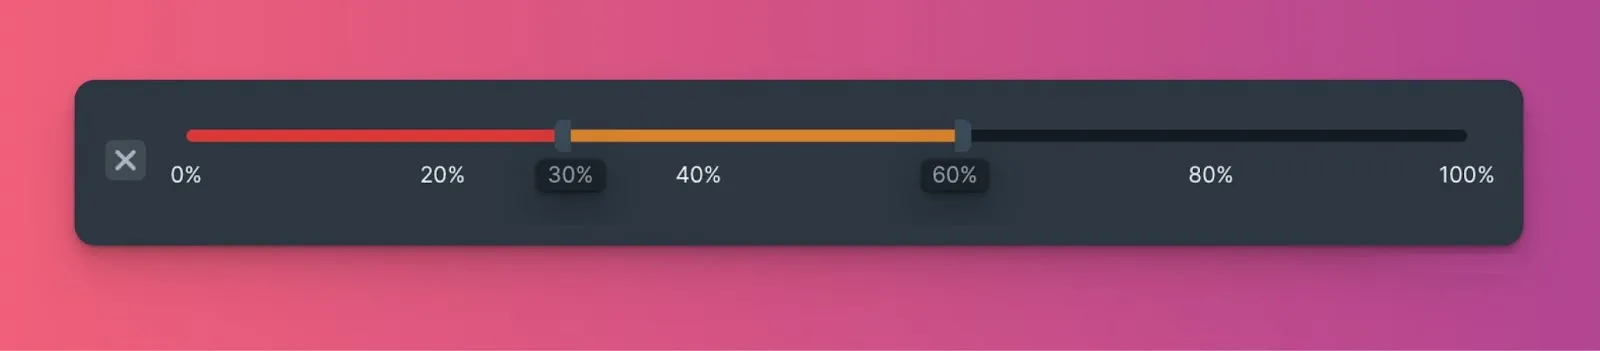
Drag the levers to adjust the alignment percentage thresholds.
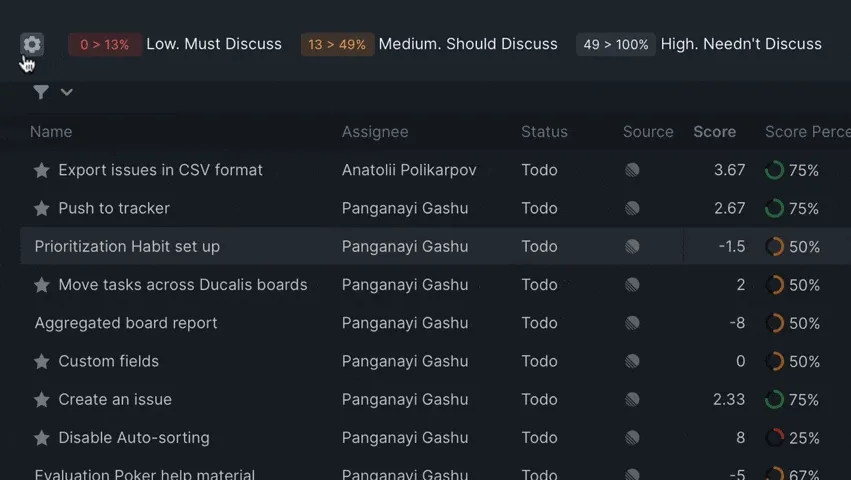
Changes apply only to this report and don't affect the other report.
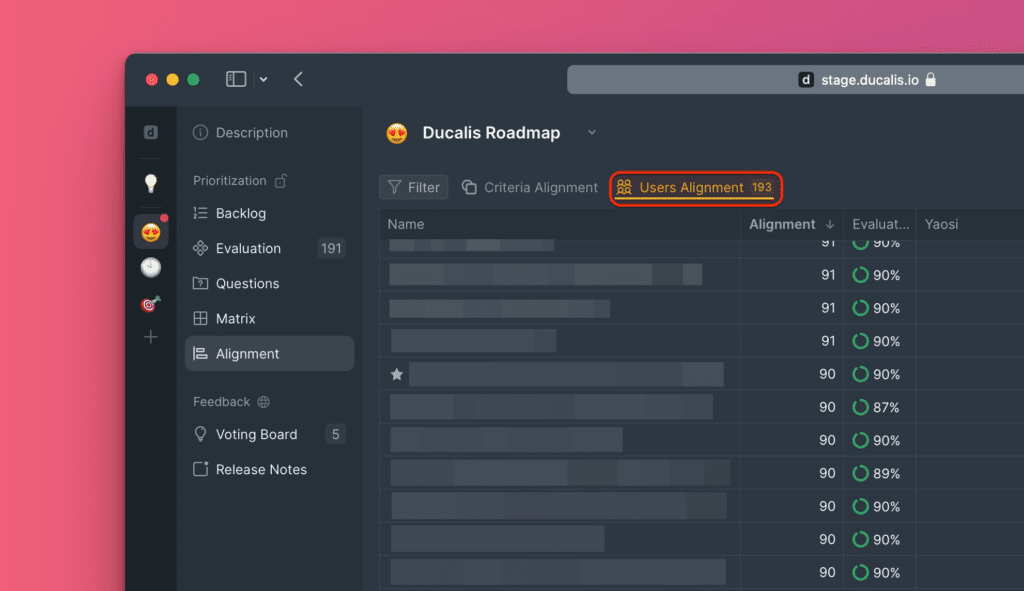
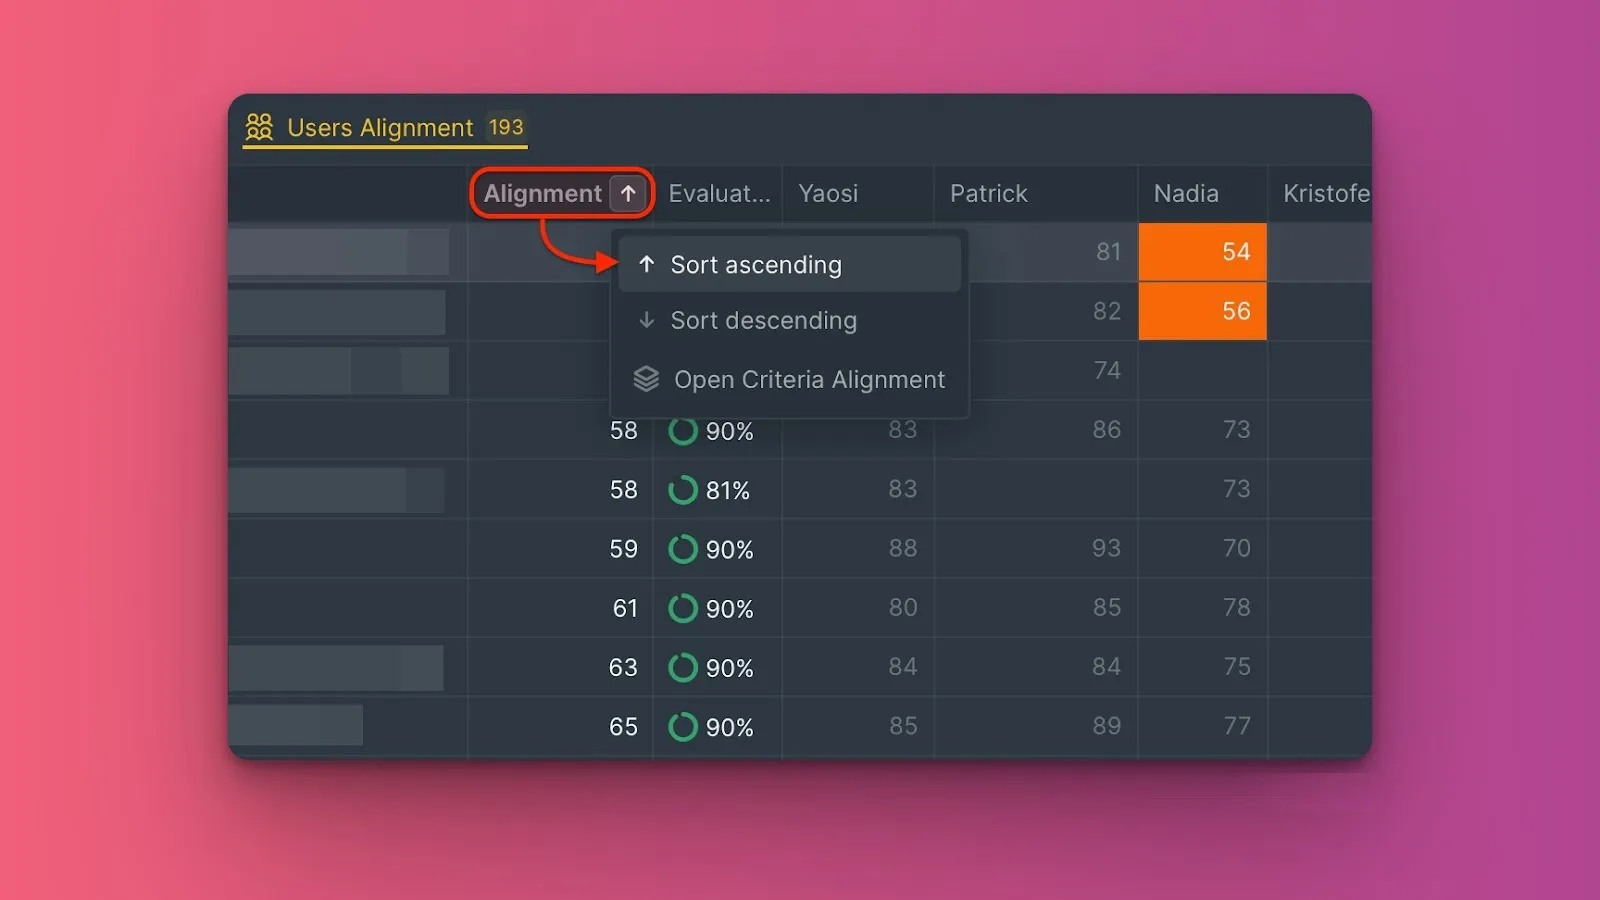
Users Alignment report
View how each evaluator scored issues compared to the rest of the team.
-
Click Users Alignment.

-
Sort issues by alignment to see the least aligned issues at the top (ascending order).
-
Hover over the alignment percentage at the intersection of an issue and a user to see all scores that user assigned to the criteria they evaluated.

Orange and red cells indicate the evaluator's scores differ significantly from the team. Discuss this user's perspective on the issue.
Customize the alignment scale
-
Click the cogwheel icon.
-
Drag the levers to adjust the alignment percentage thresholds.
Changes apply only to this report and don't affect the other report.
Filter issues by alignment level
Use filters to focus on specific alignment ranges.
Example: View only medium to low alignment issues
-
Click the filter icon.
-
Click +Filter.
-
Select Alignment > less than > enter percentage (e.g., 50%).
-
To save the filter, click Save filter > enter a name > Save.
Re-evaluate issues
When you identify alignment problems, evaluators can re-score the issue in the task card. Facilitators can also manually edit the Final Scores.