Cross-Functional Prioritization Framework for Enterprise
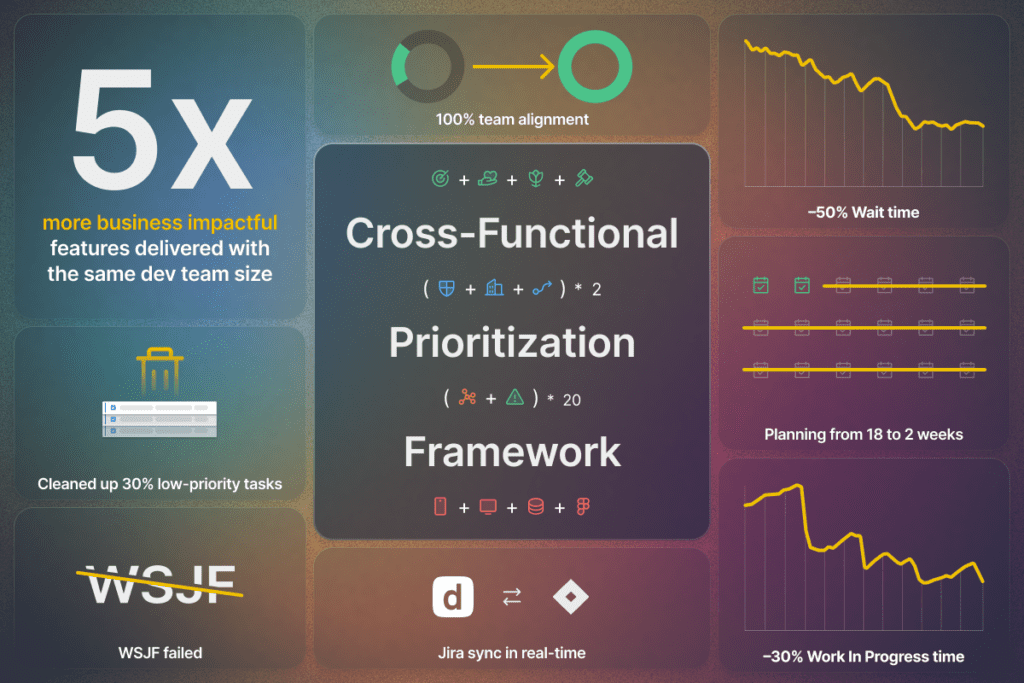
A retail giant slashed software development planning time by 9x (from 18 to 2 weeks) and delivered 5x more impactful features without increasing their development team.
The key? Embracing cross-functional prioritization.
This remarkable efficiency unlocked a treasure trove of unexpected benefits beyond speed and impact.
Unexpected Wins
"We finally have a single decision-making process," said a developer. "It's like flipping a light switch—clear priorities, no more endless debates."
"Every priority is 100% evaluated and agreed upon by everyone, not just gut feelings or power plays. Now, we trust the system."
"It's transparent—we all know how the priority score is calculated, and every stakeholder, gatekeeper, and potential stopper has their say before anything hits the dev queue. No more dragging tasks—we know what truly matters."
"We talk to each other now. Software and Business teams. It's a whole new level of understanding and decreased conflicts."
"I found a task buried in the Jira backlog that helped boost order redemption by X% percentage points; at our volume, it translates to millions in additional revenue. This gem would have remained hidden if I hadn't evaluated the tasks through our new prioritization process."
About the company
Imagine managing dozens of software products for a retail giant with hundreds of stores, millions of customers, and a core business built on bricks and mortar. That's the retailer's challenge (name withheld due to privacy concerns). Their software department, with hundreds of engineers, needed a way to navigate the complexity and deliver impactful features fast. What they achieved next is remarkable.
Misaligned Priorities Strained Development Resources
The retailer's software department faced a daunting reality:
-
Overload: Every six months, they were swamped with 2,000+ requests, dwarfing capacity and highlighting the need for razor-sharp focus.
-
Growth vs. Efficiency: Scaling the software team isn't the silver bullet. Capital efficiency is king, especially during times of turbulence.
-
The Negotiation Black Hole: Allocating 18 weeks (4.5 months) annually to debate and align on priorities meant navigating a sea of ambiguity over what's crucial, simple, complex, or still relevant.
-
Shifting Sands: By release time, the fast-changing business environment often rendered tasks obsolete. Stakeholders frequently found the final product no longer met their needs, underlining the urgency for a prioritization process that adapts in real time.
-
Untapped Potential: Precious developer resources were not spent on business-critical tasks.
The prioritization aim:
-
Minimize planning overhead.
-
Ensure development firepower is laser-focused on what truly moves the needle for the business.
From Spreadsheets to Stalemate: Why WSJF Couldn't Keep Up
Embarking on digital transformation, the retailer initially chose the Weighted Shortest Job First (WSJF) framework, using spreadsheets for prioritization. This method, however, fell short:
-
Three months were spent without finalizing priorities.
-
Broad, subjective criteria: WSJF relies on general concepts like "risk," "job size," and "criticality," which can be interpreted differently by various roles and departments. This subjectivity led to misalignments and frustrations, with valuable, complex tasks overlooked in favor of seemingly "easier" ones.
-
Quick Wins vs. True Value: WSJF's Shortcomings in a Growing Business. Formulas, like dividing by effort, could prioritize smaller, non-significant tasks over strategically critical ones. This created a backlog dominated by quick wins, neglecting essential but complex projects like legal and compliance tasks.
-
Spreadsheet swamp: Spreadsheets quickly became a nightmare—slow, error-prone, and requiring constant manual updates. Keeping data consistent with Jira became a tedious copy-paste exercise, hindering efficiency and transparency.
Top learnings from limitations of WSJF:
-
WSJF and similar frameworks don't fit the complexity of larger organizations.
-
Avoid formulas prioritizing effort over value (division by Effort) to ensure focus on impactful projects.
Stage I: Unified Prioritization Over Isolated Decision-Making
After their initial struggles with WSJF, the retail giant knew it needed a fundamentally different approach.
The biggest culprit wasn't the framework itself but the traditional, siloed decision-making process.
Imagine prioritization within individual teams (product, growth, software) with limited input from other crucial stakeholders like legal, security, support, risks, etc. This led to siloed perspectives, misaligned priorities, and constantly shifting delivery estimates due to late-stage feedback loops.
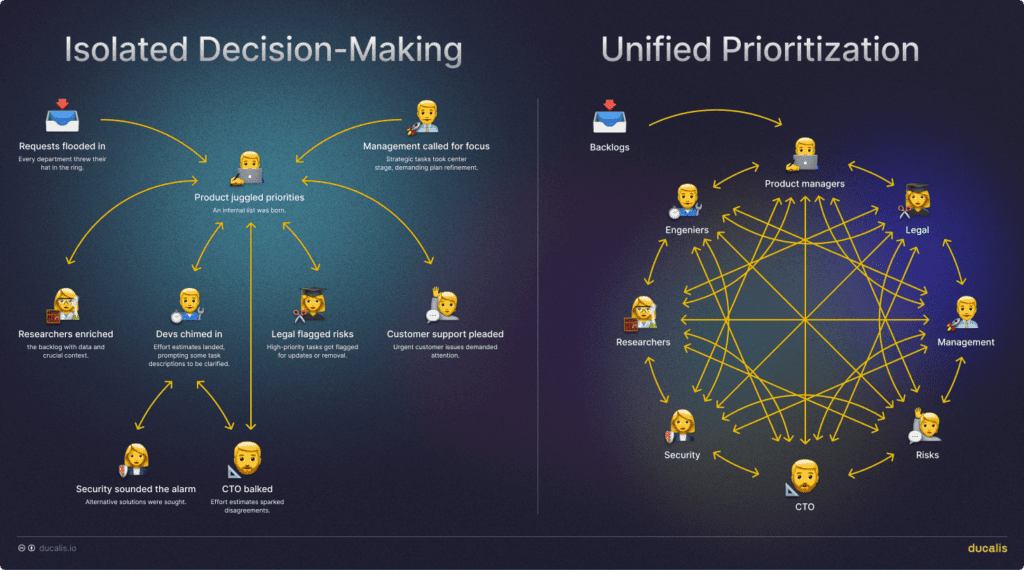
Their radical solution: embrace the "Summitinals" process. Instead of isolated decisions, they invited everyone to the prioritization table. All voices were heard, from designers to engineers, marketers to legal, support, logistics, and even some retail store managers. This created a shorter feedback loop, ensuring everyone was aligned, and potential roadblocks were identified early on.
Benefits of Unified Prioritization
The shift to a holistic prioritization process not only streamlined decision-making but also brought significant advantages:
-
Relevance Verification: Ensures the ongoing relevance of Issues, confirming that problems addressed remain priorities for the business.
-
Solution Alignment: By keeping all stakeholders in the loop, the process guarantees that proposed solutions effectively tackle the current challenges, avoiding misalignment between problem and solution.
-
No Post-Release Surprises: Involving various perspectives, including architects, legal teams, risk management, and security, ensures that potential concerns are addressed before release, preventing unforeseen issues from emerging.
This approach fosters a culture of transparency and collaboration, where every voice is heard, and every solution is vetted for its impact and relevance.
"No one in the Business and Software units had any doubt that the tasks selected for development were the most prioritized and significant for the business." Head of Product Approach Methodology Competence Center
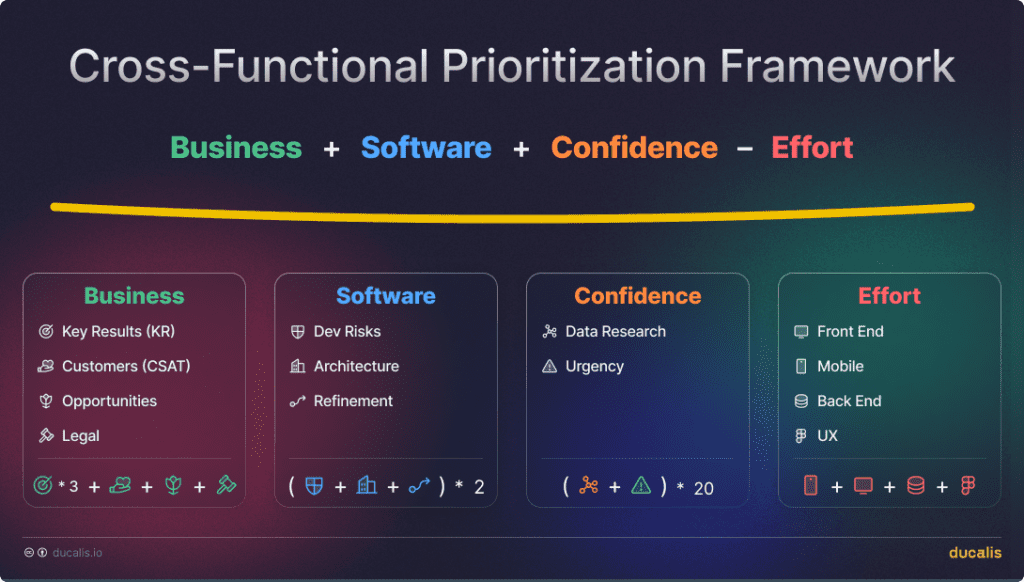
Stage II: Crafting a Custom Cross-Functional Prioritization Framework
In developing their unique prioritization framework, the retailer embraced a principle allowing true cross-functional collaboration. Links for using the template are at the end of the article.
A proprietary cross-functional framework emerged. Each role received specific criteria to weigh tasks, ensuring everyone had a meaningful voice. This tackled the "golden rule" head-on:
The best prioritization framework mirrors the company's processes and is understandable to every decision-maker.
As a result, the company created a proprietary framework that resonated with its unique needs and dynamics.
Pro Tip: Always clearly define and rename prioritization criteria to eliminate ambiguity. This ensures everyone is on the same page and contributes meaningfully to the prioritization process.
"Successfully accommodated the diverse interests of many stakeholders and obtained a prioritized queue of requests within a reasonable timeframe." Head of Data Analysis
Business Criteria
Key Results (KR): the direct impact on a product/process/function/company KPI.
Weight: 3
That criterion must be renamed to a product-specific result or metric. Objective: Identify tasks to improve a specific numerical business metric within the same or, at most, the following season. Evaluation Basis: Consider whether a task directly influences BI/KPI-focused outcomes. Even if a task doesn't immediately alter performance indicators, it warrants a higher score based on this strategic alignment if it contributes to KPI-related goals. This criterion ensures prioritization aligns with strategic goals, focusing on tasks that offer tangible improvements to critical business metrics.
Scale:
-
1: No direct impact on any metrics.
-
2: Negligible influence, unlikely to be seen in metrics.
-
3: Minor impact, possibly noticeable in metrics.
-
5: Moderate impact, with some level of confidence.
-
8: Significant expected impact, supported by calculations.
-
13: Major expected impact on company/function, with efficiency calculations and KPI confirmations.
-
21: Substantial expected impact, confidently supported by pilot data, benchmarks, and references.
Task Examples:
-
1: Tracking product selection rules views.
-
2: Improving product layout on iPhone 4s.
-
3: Enhancing display quality of product selection rules on all mobile devices.
-
5: Adding product selection rules.
-
8: Displaying product availability by size.
-
13: Ordering multiple sizes for delivery.
-
21: Implementing site-wide product ordering.
Customer Satisfaction (CSAT): gauges user satisfaction and the number of users affected by a change.
Weight: 1
Objective: Assess how eagerly users await changes, which users will be affected, and the extent of the user/customer impact. Includes external customers and company employees who benefit from task completion, enhancing work efficiency.
Evaluation Focus: The inherent value of the task in generating user satisfaction.
-
1: No impact on user joy.
-
2: Barely noticeable improvements by a few.
-
3: A small segment of users will appreciate the change.
-
5: Noticeable by a quarter of customers, half of business users, or department heads.
-
8: Half of the customers, all business users, or function leaders will notice improvements.
-
13: All customers, business users, and function leaders eagerly anticipate the change.
-
21: The feature is in high demand, with constant inquiries from customers, business users, and even unsolicited feedback from the public.
Task Examples:
-
1: Tracking email delivery.
-
2: Improving email layout for Lotus Notes.
-
3: Enabling alt text for images in emails.
-
5: Adapting email layouts for Gmail.
-
8: Sending notifications adjusted for time zones.
-
13: Introducing a notification center in the mobile app.
-
21: Manage notifications subscriptions in the mobile app.
Opportunities: the potential for strategic investments and eliminating development obstacles.
Weight: 1
Clear the way for development or open up new avenues for the company's growth. This includes tasks part of broader strategic initiatives (BI/KPI aligned) facilitating such developments. It may not influence revenue in a short-term period.
-
1: Opens no new opportunities.
-
2: Offers negligible opportunities.
-
3: Creates local opportunities for business processes/product features.
-
5: Provides substantial opportunities for business process/product feature development.
-
8: Unlocks opportunities with potential future impact on function or business process, visible in future metrics.
-
13: Opens significant opportunities with a foreseeable major impact on the company or function, reflected in future metrics.
-
21: Unveils critical opportunities for meeting the company's long-term strategic plans.
Task Examples:
-
1: Placing a static banner on the product page.
-
2: Ability to change banners on the website's product pages from the admin panel.
-
3: Customizable banners on all fronts in product pages from the admin panel.
-
5: A/B testing two banners on product pages across all fronts from the admin panel.
-
8: Testing two or more banners on product pages across all fronts.
-
13: Banner testing with automatic winner selection and minimizing revenue loss during testing.
-
21: Automatic selection of communications, placement locations, and users across all fronts with testing the best selection algorithm.
Legal: The potential legal risks, reputational damage, and fines associated with a task.
Weight: 2
Focus: Identifies the task's impact on legal standings, including user lawsuits, reputational damage from legal disputes, and penalties for non-compliance with laws.
Scale:
-
-10: Greatly increases legal risks.
-
-6: Significantly increases legal risks.
-
-2: Marginally increases legal risks.
-
0: Neutral impact on legal risks.
-
2: Slightly mitigates legal risks.
-
6: Considerably reduces legal risks.
-
10: Drastically reduces legal risks.
Examples:
-
-10: Introducing non-compliant data collection practices.
-
-6: Implementing a feature with potential privacy concerns.
-
-2: Minor contract changes requiring legal review.
-
0: No impact on legal risks.
-
2: Improving accessibility compliance.
-
6: Enhancing data security measures.
-
10: Implementing industry-standard encryption protocols.
Software Criteria
Dev Risks: IT risks like decreased team throughput, increased maintenance, or security vulnerabilities.
Weight: 2
Addresses risks such as decreased team throughput, unwarranted increase in maintenance effort, creation of manual processes, heightened system fragility, reduced performance, diminished security, and other related IT risks.
Scale:
-
-10: Significantly escalates IT risks.
-
-6: Substantially increases IT risks.
-
-2: Slightly raises IT risks.
-
0: Has no impact on IT risks.
-
2: Marginally decreases IT risks.
-
6: Notably reduces IT risks.
-
10: Drastically mitigates IT risks.
Examples:
-
-10: Introducing a complex, unmaintainable codebase.
-
-6: Implementing a feature with known security vulnerabilities.
-
-2: Adding a new dependency that requires additional maintenance.
-
0: No impact on IT risks.
-
2: Refactoring code to improve maintainability.
-
6: Implementing security best practices.
-
10: Migrating to a secure cloud infrastructure.
Architecture: Determines if a task aligns with the target architecture or addresses technical debt.
Weight: 2
Assessment Focus: The task's merits regarding architectural contribution or debt reduction.
-
-10: Drastically increases debt (major workaround).
-
-6: Significantly increases debt (significant workaround).
-
-2: Slightly increases technical debt (minor workaround).
-
0: Neutral impact on architecture; neither advances nor regresses from the target solution.
-
2: Marginally reduces debt.
-
6: Substantially moves towards the target architecture, including addressing gaps in automation.
-
10: Directly achieves the target architecture.
Examples:
-
-10: Integrating a legacy system with the core platform using custom code and point-to-point connections.
-
-6: Uses a "dead end" technology that is incompatible with the target architecture and requires additional effort to migrate away from in the future.
-
-2: A minor code refactoring due to code duplication. Short-term technical debt that can be addressed quickly in the near future.
-
0: Updating documentation or minor bug fixes.
-
2: Consolidating data sources into a single, unified platform, contributing to a cleaner and more maintainable architecture.
-
6: Aligns with the microservices architecture and reduces long-term technical debt.
-
10: Completing a large-scale migration to a cloud-based, platform-as-a-service (PaaS) solution.
Refinement: The progress made on a task, minimizing the abandonment of in-progress tasks.
Weight: 1
Objective: Determine how much of the task has been completed to prioritize the continuation and completion of work that has already begun, ensuring efficient use of resources and minimizing waste from dropped tasks.
-
55: Near completion, with less than 10% of work remaining. Minimal effort is required to finish.
-
35: Substantial work has been done, and more than 40% has been completed. It's more efficient to complete than to abandon.
-
5: Some progress was made, not specifically quantified, but enough that abandoning it would result in lost effort.
-
0: Preparation stage, with task descriptions and acceptance criteria (AC) preliminarily validated by the team.
-
-10: Task description and AC are prepared but not validated, indicating readiness for work with some uncertainties.
-
-15: Lacks clear description beyond a title, with significant ambiguities about task requirements and execution, necessitating additional clarification and planning effort.
Examples:
-
55: Write unit tests for an already implemented feature.
-
35: Update a user interface element for a purchase order for a mobile app.
-
5: Some progress made, not specifically quantified but enough that abandoning would result in lost effort.
-
0: Update project documentation with recent changes.
-
-10: Improve 'in cart' page loading speed.
-
-15: Fix website issues.
Confidence Criteria
Research: Measures task confidence with supporting data.
Weight: 20
Vital for leveraging user interaction data to inform marketing and omnichannel strategies.
-
0 — No new insights; purely assumption-based.
-
21 — Collected new user behavior data, indicating evidence-based tasks with the potential for fresh insights.
Urgency: Ensures flexibility within the framework to prioritize and quickly address tasks with urgent, high-stakes implications.
This criterion is exclusively assigned to team leads or managers and activated in urgent situations.
Weight: 20
Scale: 0 or 1.
Scoring Example (1 point): Assign to tasks with immediate, significant risks such as:
-
Detected vulnerabilities that could lead to data breaches.
-
Threats of app suspension risk by platforms like App Store or Meta.
-
Legal injunctions from regulatory bodies.
-
High risk of incurring substantial fines.
Effort Criteria
Front End, Back End, Mobile, UX Criteria: Time Required for Web and Mobile products development.
It's an example of four criteria: add/edit/remove all unnecessary mirroring of your dev team structure.
Weight: 1
-
1 — Effortless: no effort is required.
-
2 — Half a day or less.
-
3 — One day.
-
5 — Two days (half a sprint).
-
8 — Four to five days (one sprint).
-
13 — More than one sprint but less than two sprints.
-
21 — Two sprints and more.
Each criterion uses a non-linear evaluation scale like 1, 2, 3, 5, 8, 13, and 21—Fibonacci Sequence.
This framework aims to balance strategic goals with practical considerations, ensuring each task is evaluated through a comprehensive lens that respects the unique contributions of all departments.
Stage III: Streamlining the Evaluation Process
The Power of Ownership: Assigning Dedicated Evaluators
The retail giant kicked off by assigning champions for each prioritization criterion. Picture this: a seamless blend of Evaluation Planning Poker and strategic foresight, where each key area—Business, IT, Research, and Urgency—gets a dedicated maestro. Initially, it was a quartet, but the ensemble grew to a 16-20-person orchestra per team, all playing harmoniously.
Sync Magic with Jira
One more process booster is the real-time two-way Jira Server integration. Each team's Jira backlog is dynamically synchronized, pulsating with real-time updates in Ducalis. A new Issue pops up in Jira. Instantly, it appears in Ducalis. A last-minute update to a backlog item? It refreshes in real-time—say goodbye to evaluating outdated tasks.
Picture this: the end of manual task shuffling. This wasn't merely an upgrade; it revolutionized teams' efficiency, streamlining the workflow like never before.
Bite-Sized Focus
Faced with the daunting expanse of the Jira backlog, the sheer volume of tasks once seemed impossible. Solution? Strategic segmentation. They sliced the mammoth backlog into digestible, bite-sized chunks, a mental decluttering that transformed a sprawling mountain of tasks into neatly organized, manageable hills. Each segment, now housing 25-50 tasks, was clearly defined and primed for evaluation.
This approach led to the creation of 150 distinct, bite-sized Ducalis Boards for each team, culminating in an aggregated master Board that showcased end-to-end priorities. It was a game-changer, simplifying the process and bringing a newfound clarity to collective efforts.
Embracing Diverse Perspectives
Acknowledging and discussing differing viewpoints is invaluable in team prioritization. With the Team Alignment report, they spot it quickly. Disparities in task value assessments could highlight misunderstandings or varying perceptions of a task's importance, signaling a need for clarification. With 20 evaluators per Board, only 5% to 10% of functions required further discussion. This was then addressed in calls, leading to a finalized score directly influenced by facilitators like team leads or product owners.
The Art of Relevancy
In the world of prioritization, diversity in thought isn't just welcome—it's essential. When opinions diverge—say, one sees gold whereas another sees gravel—it's a cue to pause and ponder. With the Team Alignment report, the difference was spotted automatically.
It appeared that roughly 5-10% of tasks sparked debate, a golden opportunity for deeper dives and richer understanding, culminating in that all-important Final Score.
Recognizing that priorities can quickly become outdated, the company adopted a practice of resetting scores every three months. This regular "peeling" ensured that obsolete tasks were phased out and closed, focusing only on the relevant Issues.
Stage IV: Cross-Functional Prioritization—500% Growth in Business Impact
Yes, you read that right. A staggering delivery of tasks with 5x more business impact. How did such a transformation occur? It all boils down to strategic task prioritization using Ducalis, a sentiment echoed by the customer's CTO:
"By simply prioritizing tasks in Ducalis, we unlocked a new level of productivity. The real magic was pairing the right tool with our envisioned process."
Planning 9x Faster
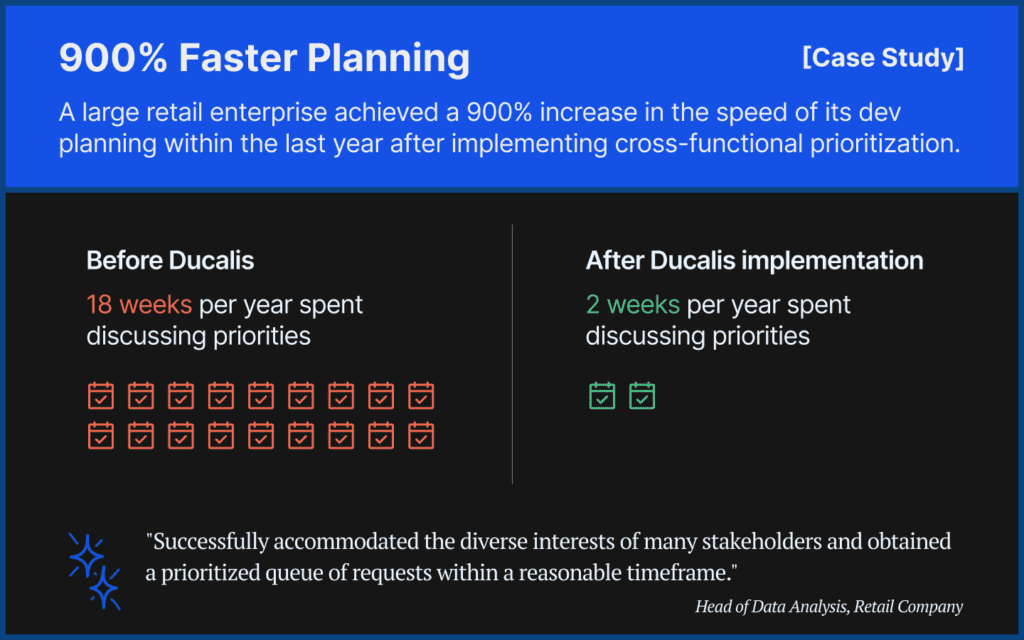
Cross-functional prioritization compressed decision-making time from an exhaustive 18 weeks (four and a half months) per year to two weeks. This quantum leap was achieved through:
-
Specialized Tools: Leveraging real-time sync between Jira and the prioritization tool streamlined the process.
-
Dynamic Criteria Updates: Adapting prioritization criteria to the evolving business landscape ensured constant alignment.
-
Automatic Misalignment Detection: Instantly identifying discrepancies kept focus sharp and relevant.
-
Simplified Process: A straightforward approach meant fewer breakdowns and bottlenecks.
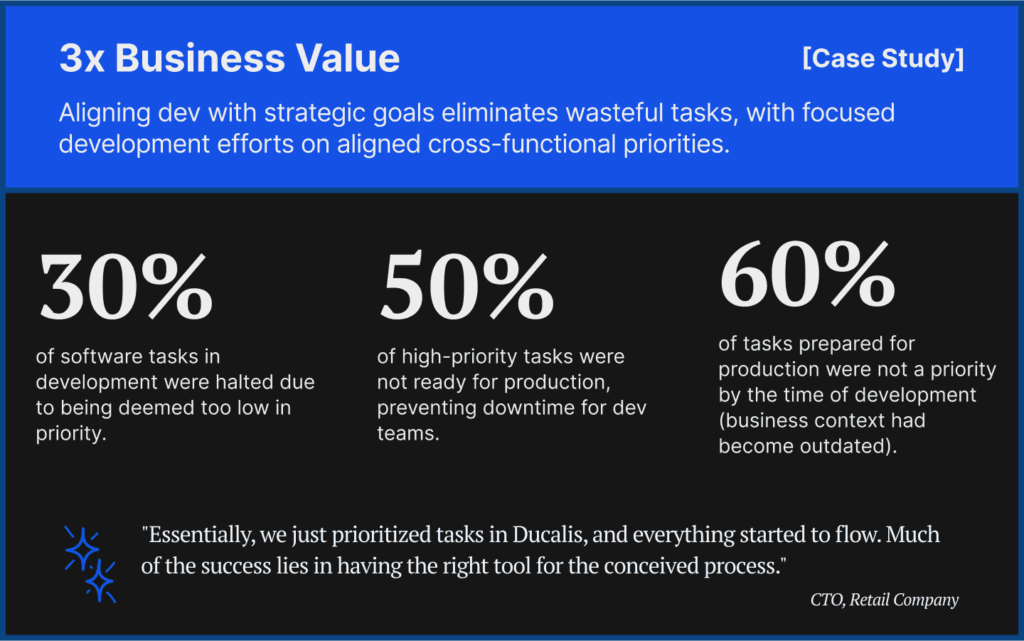
Eliminating Low-Impact Tasks
Post-prioritization, they observed:
-
30% of ongoing development tasks were removed because of low priority, reallocating resources to higher-value projects.
-
50% of top-priority tasks were unready for immediate development, allowing for preemptive problem-solving or task consolidation.
-
60% of tasks queued for production were deprioritized, losing relevance due to changing business contexts.
A Colossal Boost in Productivity
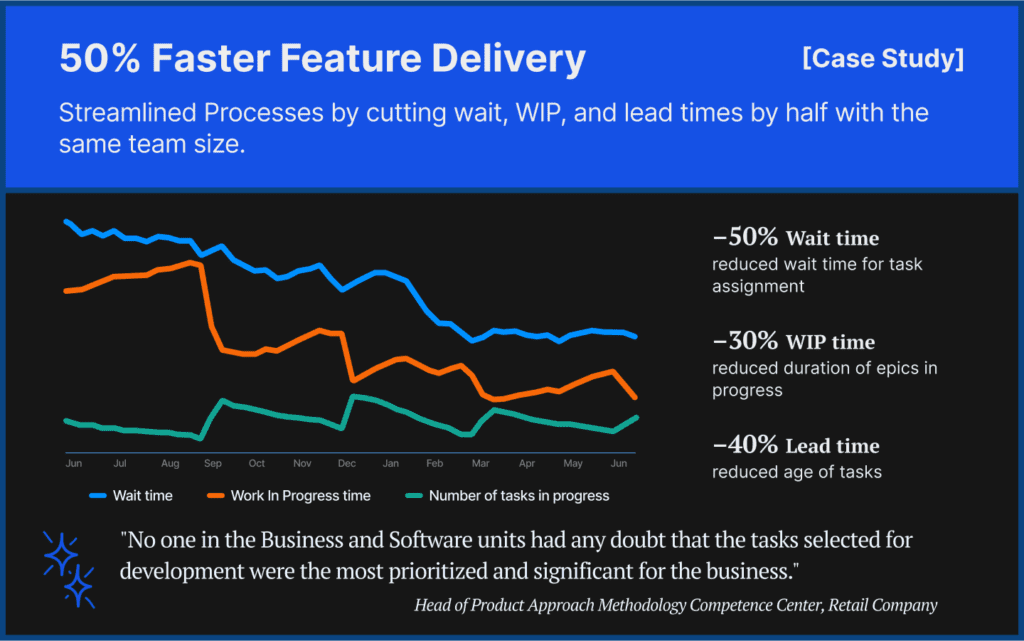
It's not just about removing unnecessary tasks but also optimizing the entire workflow with the same team size.
-
Lead time reduced by 40% (that's weeks saved)
-
Delivery cycle time slashed by 50%
-
Increased developer velocity by 2x
The journey from a cluttered backlog to a streamlined, impact-focused development pipeline is not just possible—it's a reality. If you're seeking a revolution in how your team prioritizes tasks, consider this approach your blueprint for success. The effort pays off, magnifying productivity and ensuring every task brings you closer to your business goals.
Implementing the Cross-Functional Prioritization Approach: A Step-by-Step Guide
With ready-made templates and detailed guidelines, adopting this method within your organization is straightforward. While the steps below are based on setting up Ducalis, the core principles can be experimented with spreadsheets.
-
Start with a Template: Create a prioritization Board using a framework template. This serves as your foundation.
-
Import Your Backlog: Bring in a segment of your backlog (30-50 tasks) from your task tracker (e.g., Jira Cloud/Server, Asana, Linear, ClickUp, GitHub, Trello, YouTrack). Optionally, set up to sync prioritization results back to your task tracker for a seamless workflow.
-
Customize Criteria: Review all criteria thoroughly. Would these criteria resonate with your team during discussions? Are the terms familiar, or do they need tweaking? Adjust descriptions to align with your team's language, remove what's not required, and add any criteria that might be missing.
-
Assign Responsibility: Designate one or more individuals responsible for each criterion. These can be any combination of team members, ensuring broad representation and expertise.
-
Engage Your Team: Invite all participants to evaluate the tasks. This collective effort is crucial for a comprehensive assessment.
-
Refine with Alignment: Utilize the Alignment section to adjust scores as necessary, ensuring consensus and addressing discrepancies.
-
Evaluate the Outcome: Review the prioritized list of tasks. Fine-tune the weights and the number of criteria as needed to refine the priorities further.
Embracing this approach streamlines your prioritization process and fosters a collaborative environment where every task is assessed through a multifaceted lens. Dive in, experiment, and watch your team's productivity and focus soar.
Download the case study in PDF.
Try Ducalis with Enterprise framework—sign up for free with all the presets.
FAQ
Is the process too time-consuming to be worth it?
Adopting this framework transforms project prioritization. Teams often discover that what seemed "promising" may not stand up to cross-functional scrutiny, while overlooked "nice-to-have" features emerge as high-ROI opportunities. The real win? Unearthing hidden gems in the backlog that could have been missed otherwise.
How can people not deeply involved in a project effectively evaluate tasks?
The strength of cross-team prioritization lies in inclusivity—bringing together everyone who might impact a task's execution, not just a narrow product/growth/technical circle. We encountered challenges with unclear task descriptions for individuals in other roles. The "unable to evaluate" option led to many tasks being pulled for re-description by their authors. Initially met with resistance, this practice eventually fostered "positive pressure" on task authors to refine, consolidate, or remove tasks, naturally enhancing backlog refinement with clear motivation.
What's the ideal number of participants in the prioritization process?
-
4 people provide a solid start, with at least one representative from each central unit (Business, Software, Analyses, Urgency).
-
10 people achieve more comprehensive coverage, ensuring at least one evaluator per criterion.
-
20+ people are optimal, allowing multiple evaluators per criterion to cross-verify estimates and identify misalignments.
What if some roles, like legal, can't evaluate specific tasks?
That's completely normal and manageable through a few approaches:
-
They may skip the task for re-evaluation later, especially if it's deemed necessary upon review.
-
Pose questions for task clarification.
-
Adjust the Board's backlog sync to refine the selection of tasks for evaluation.
How do you address the "all tasks are urgent and top priority" dilemma?
Leverage the Evaluation Poker feature to conceal estimations from others. This encourages unbiased assessment and helps prioritize genuinely critical tasks, mitigating the tendency to mark everything as urgent and high priority.