When you are evaluating your backlog for prioritization, you can view and analyze your prioritization results.
The Backlog Page
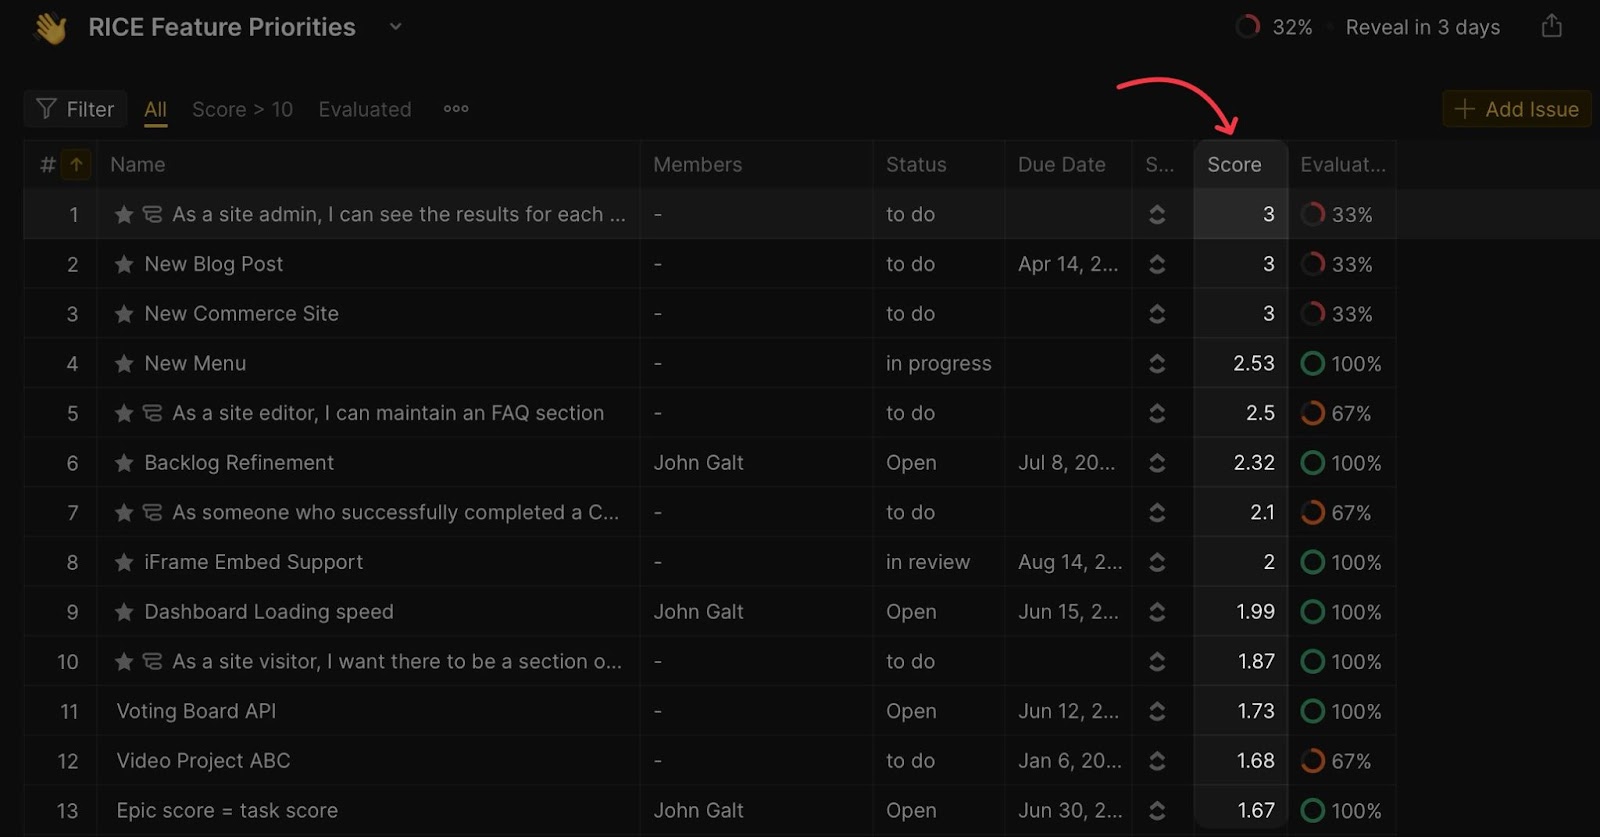
On the backlog page, you can see a list of all the issues in your product backlog. By default, they are arranged in order of priority, with the issue that’s the highest priority (highest total score) at the top.

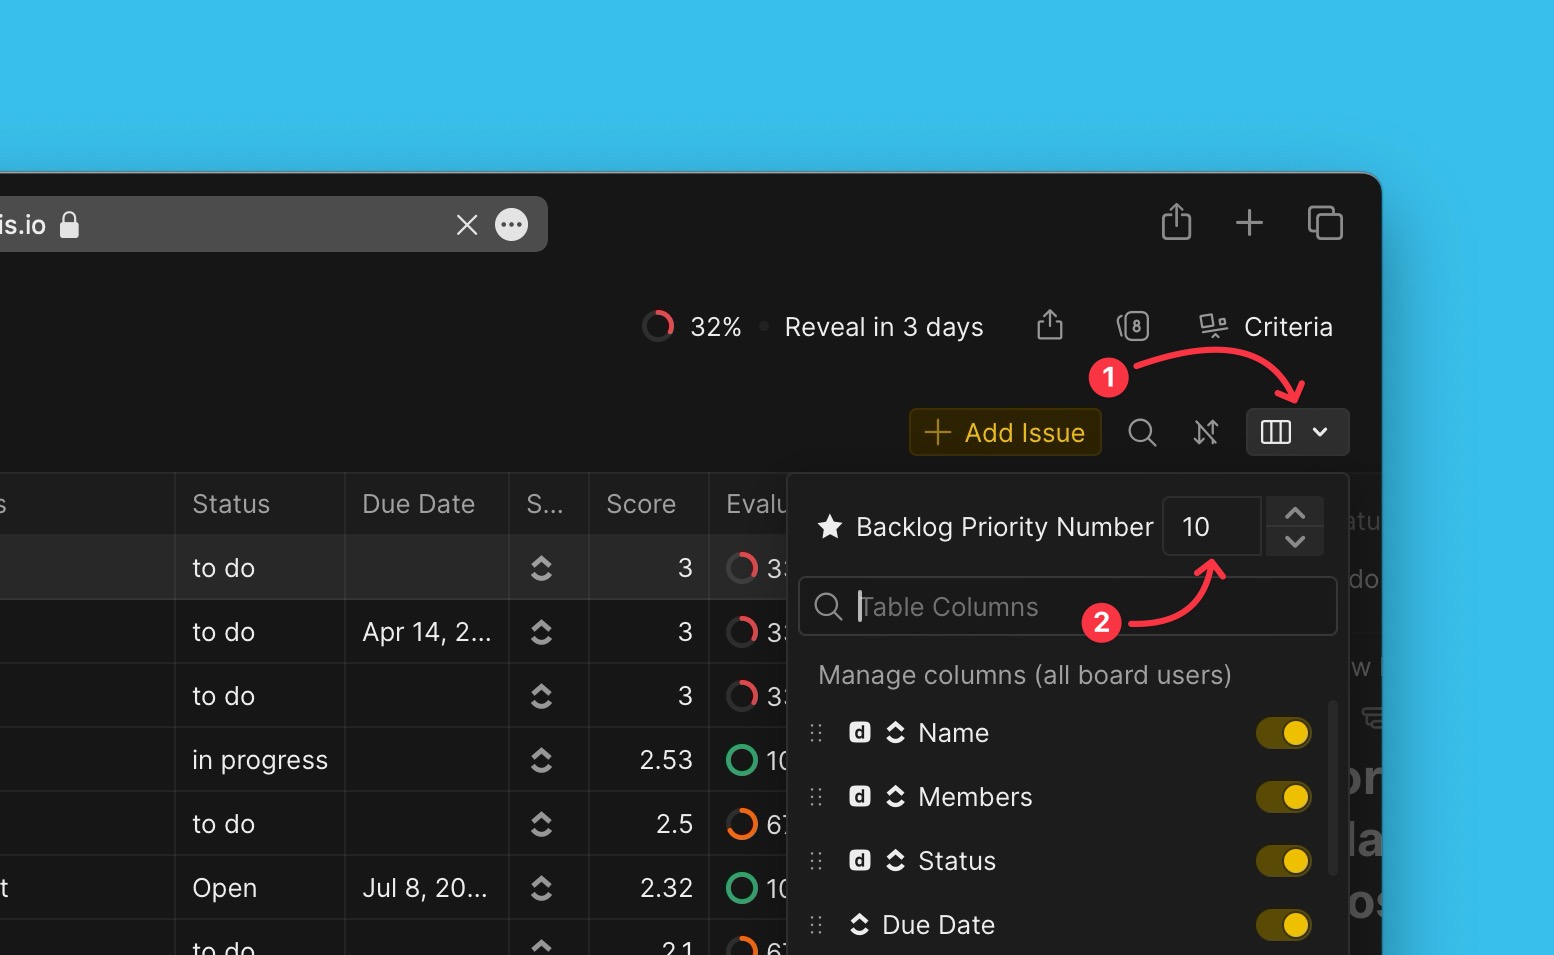
Top priority issues are starred. You have the option to choose the number of issues you want on your top priority list. The top priority number is necessary to highlight how many issues your team can take into the sprint.
Go to table customization settings on the Backlog priority number, and enter the number of issues you want on your top priority list.
The total scores are found under the scores’ column, with the highest score at the top.
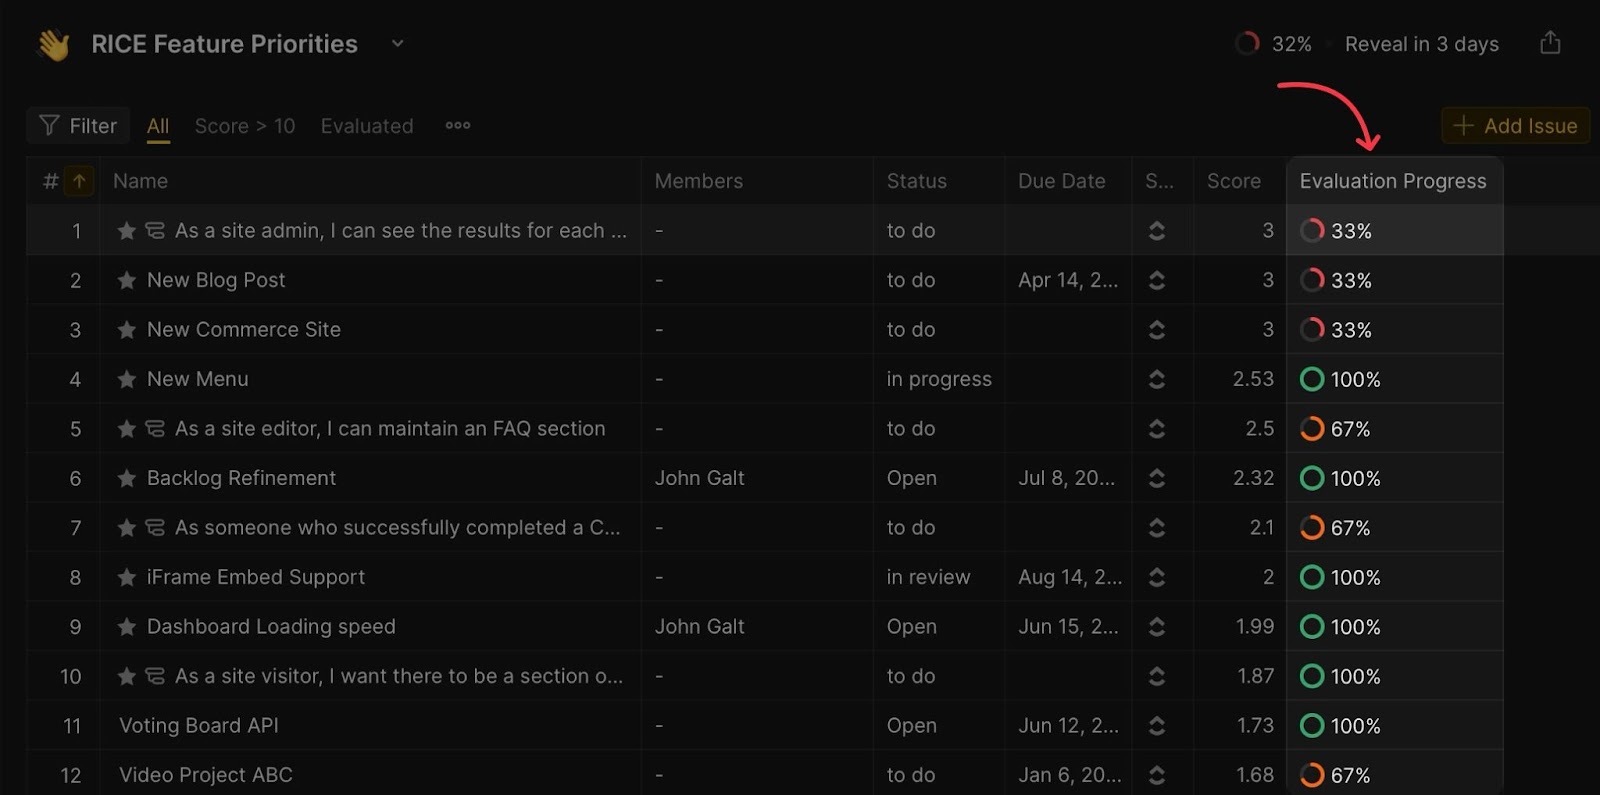
View the evaluation progress under the Evaluation progress column. This column shows the percentage of people who have evaluated an issue.
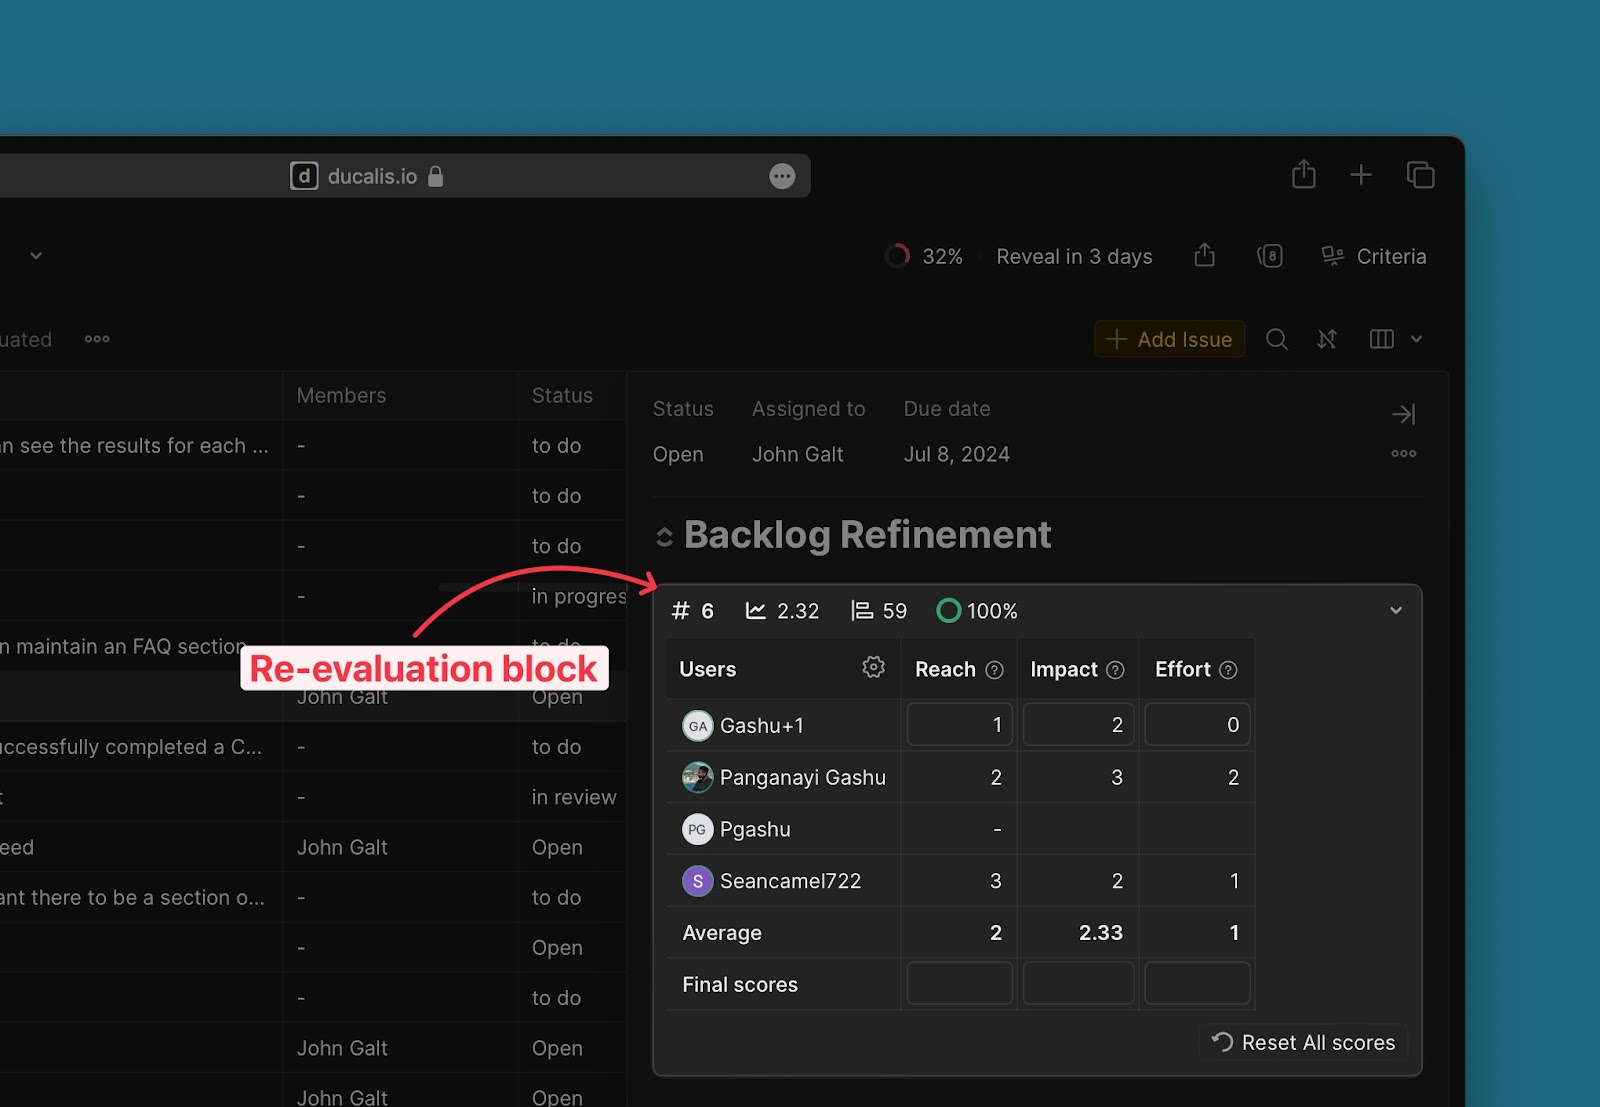
Under a task card, you have the re-evaluation block where you can further analyze your results—view your scores and your teammates’ scores under each criterion.
The Matrix Page
Here there is a 2×2 matrix grid of value against effort. It gives you a Bird’s eye view of your prioritization results. It helps you visualize and pick out top-priority issues from your backlog using the famous Eisenhower approach.
On the matrix diagram, Value (y-axis) is plotted against Effort (x-axis). The diagram is divided into four priority quadrants that help you to categorize your issues by priority.
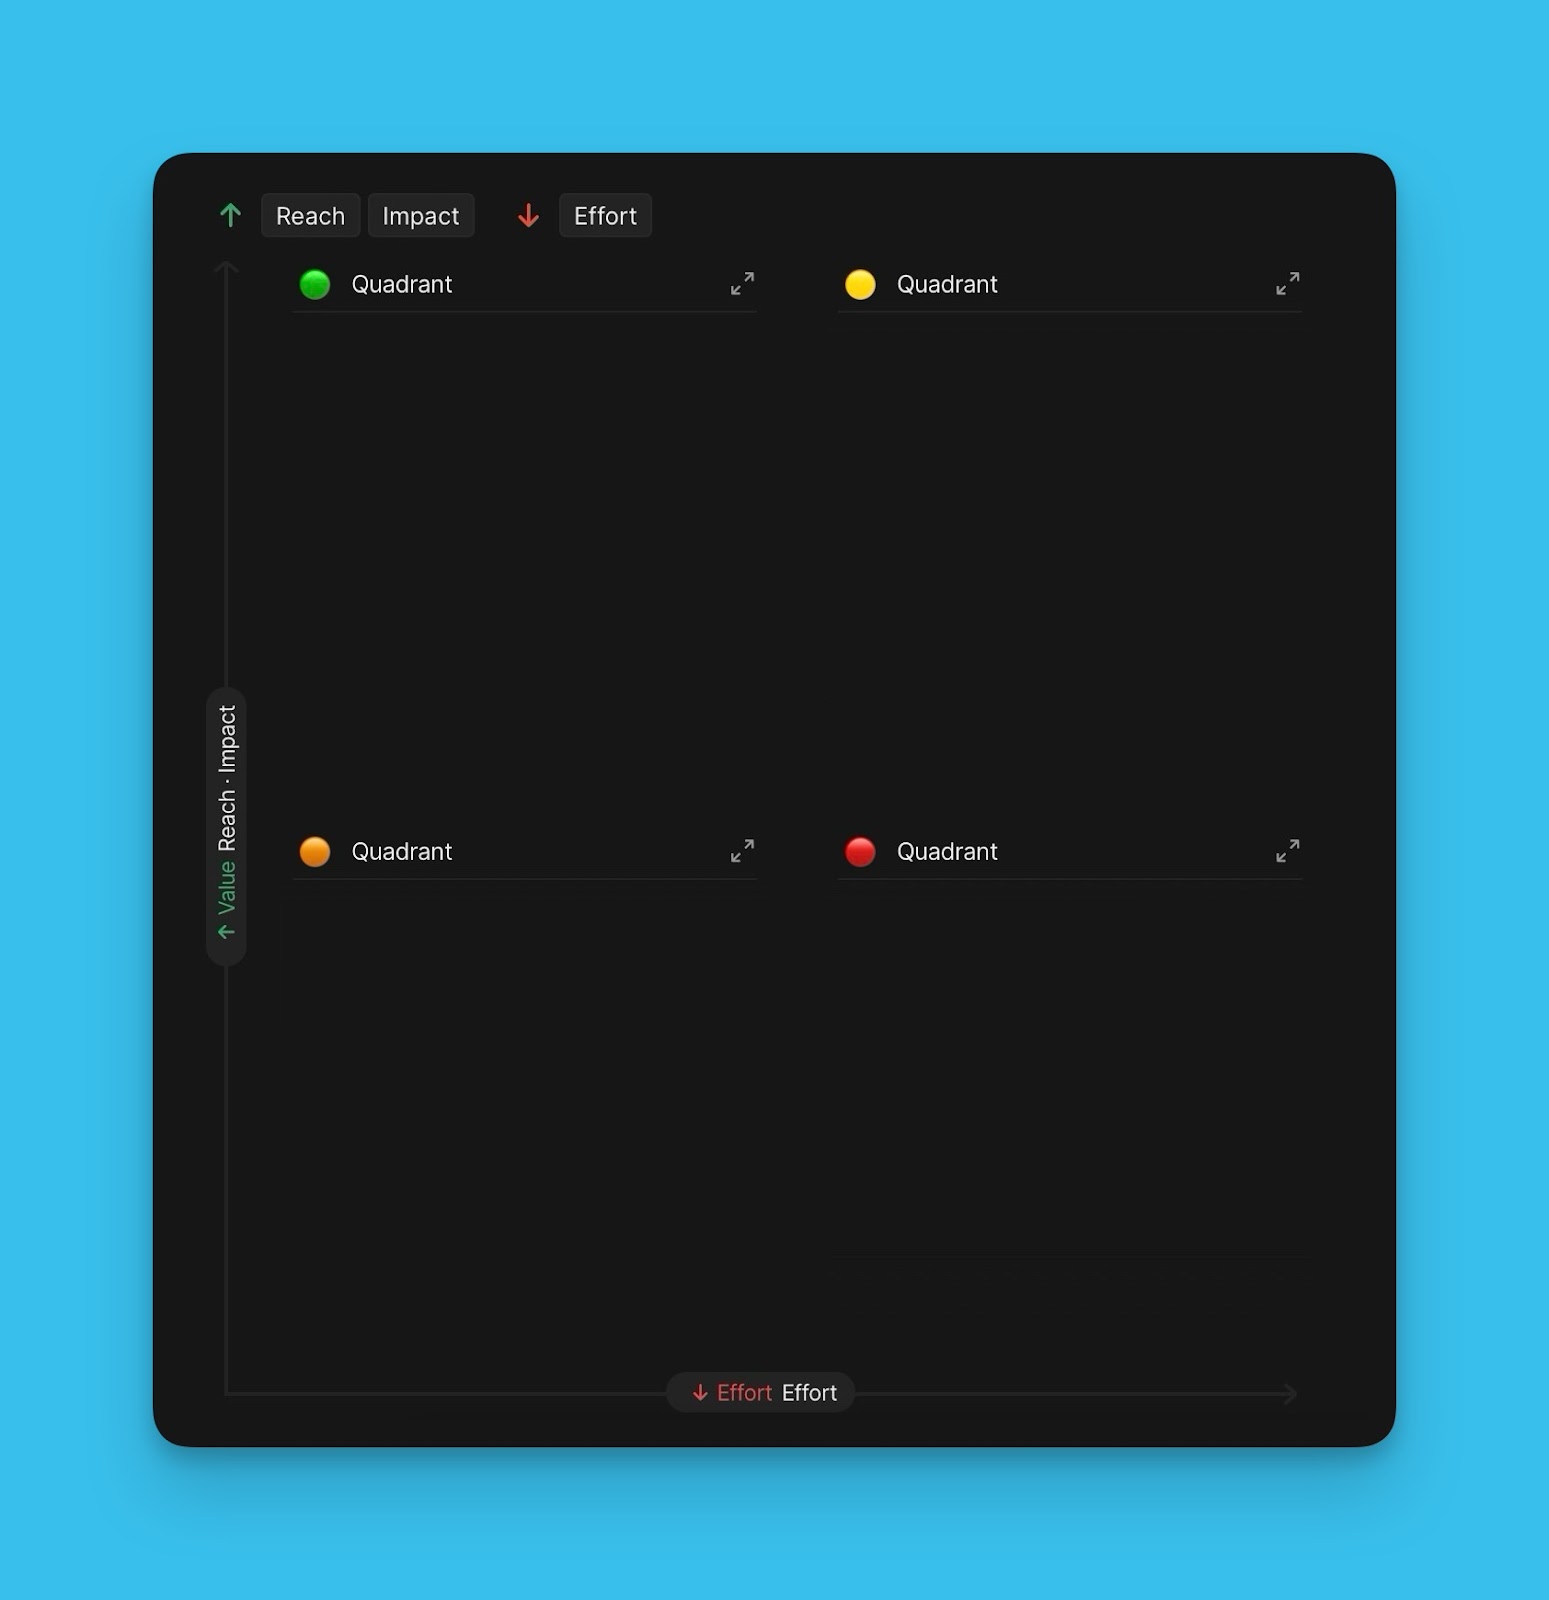
The 1st quadrant has the top priority issues and the 4th quadrant has the least priority issues.
Priority Matrix Grid Views
The Prioritization matrix has two views that you can use to visualize your prioritization results. There is:
- The List view.
- The Chart view.
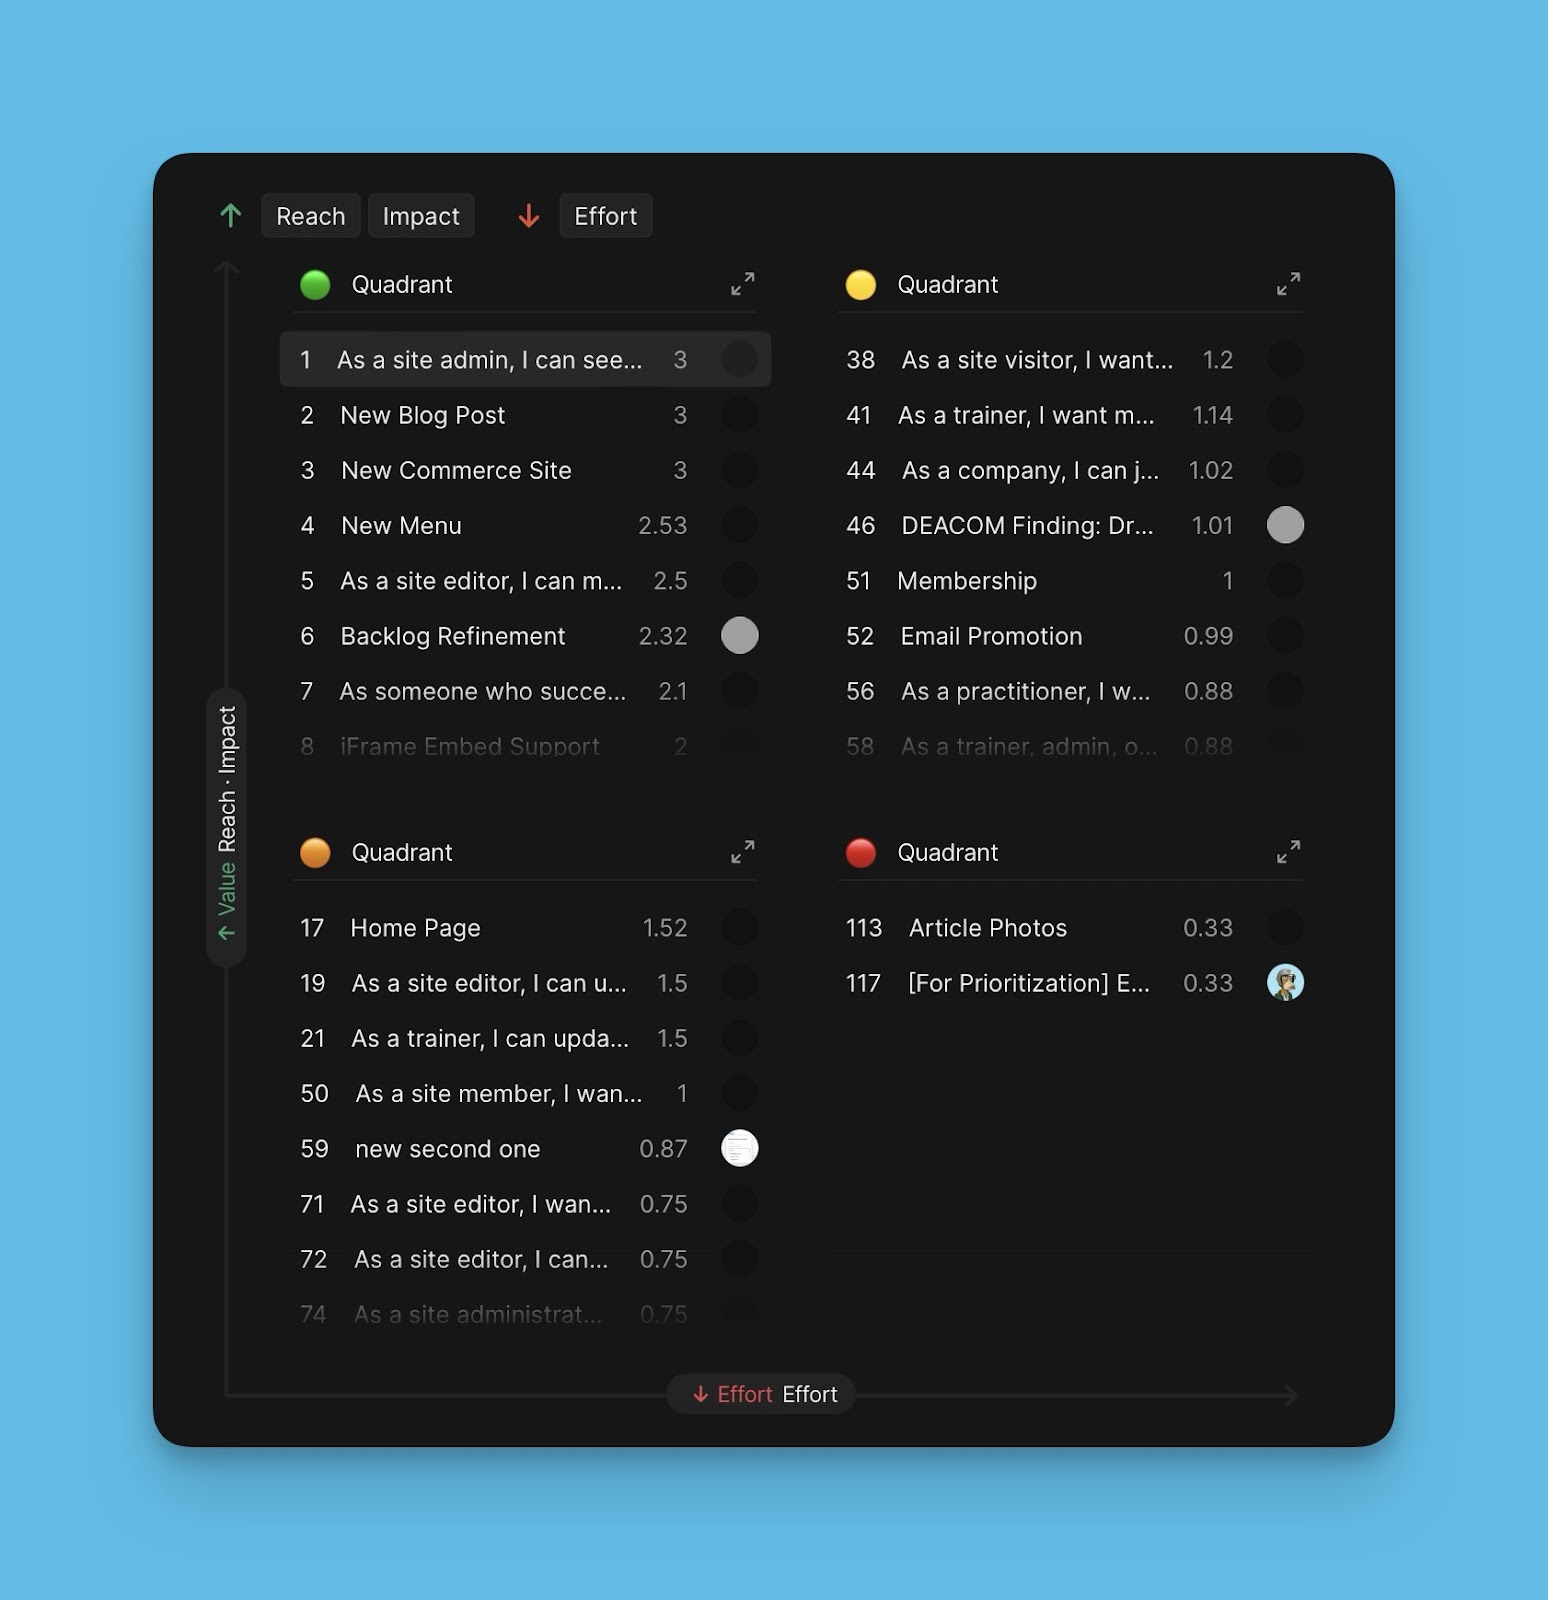
The List View
With this view, you can see the issues falling into each quadrant in the form of a list. The Issues in the list are arranged in order of priority, with the top priority issue at the top.
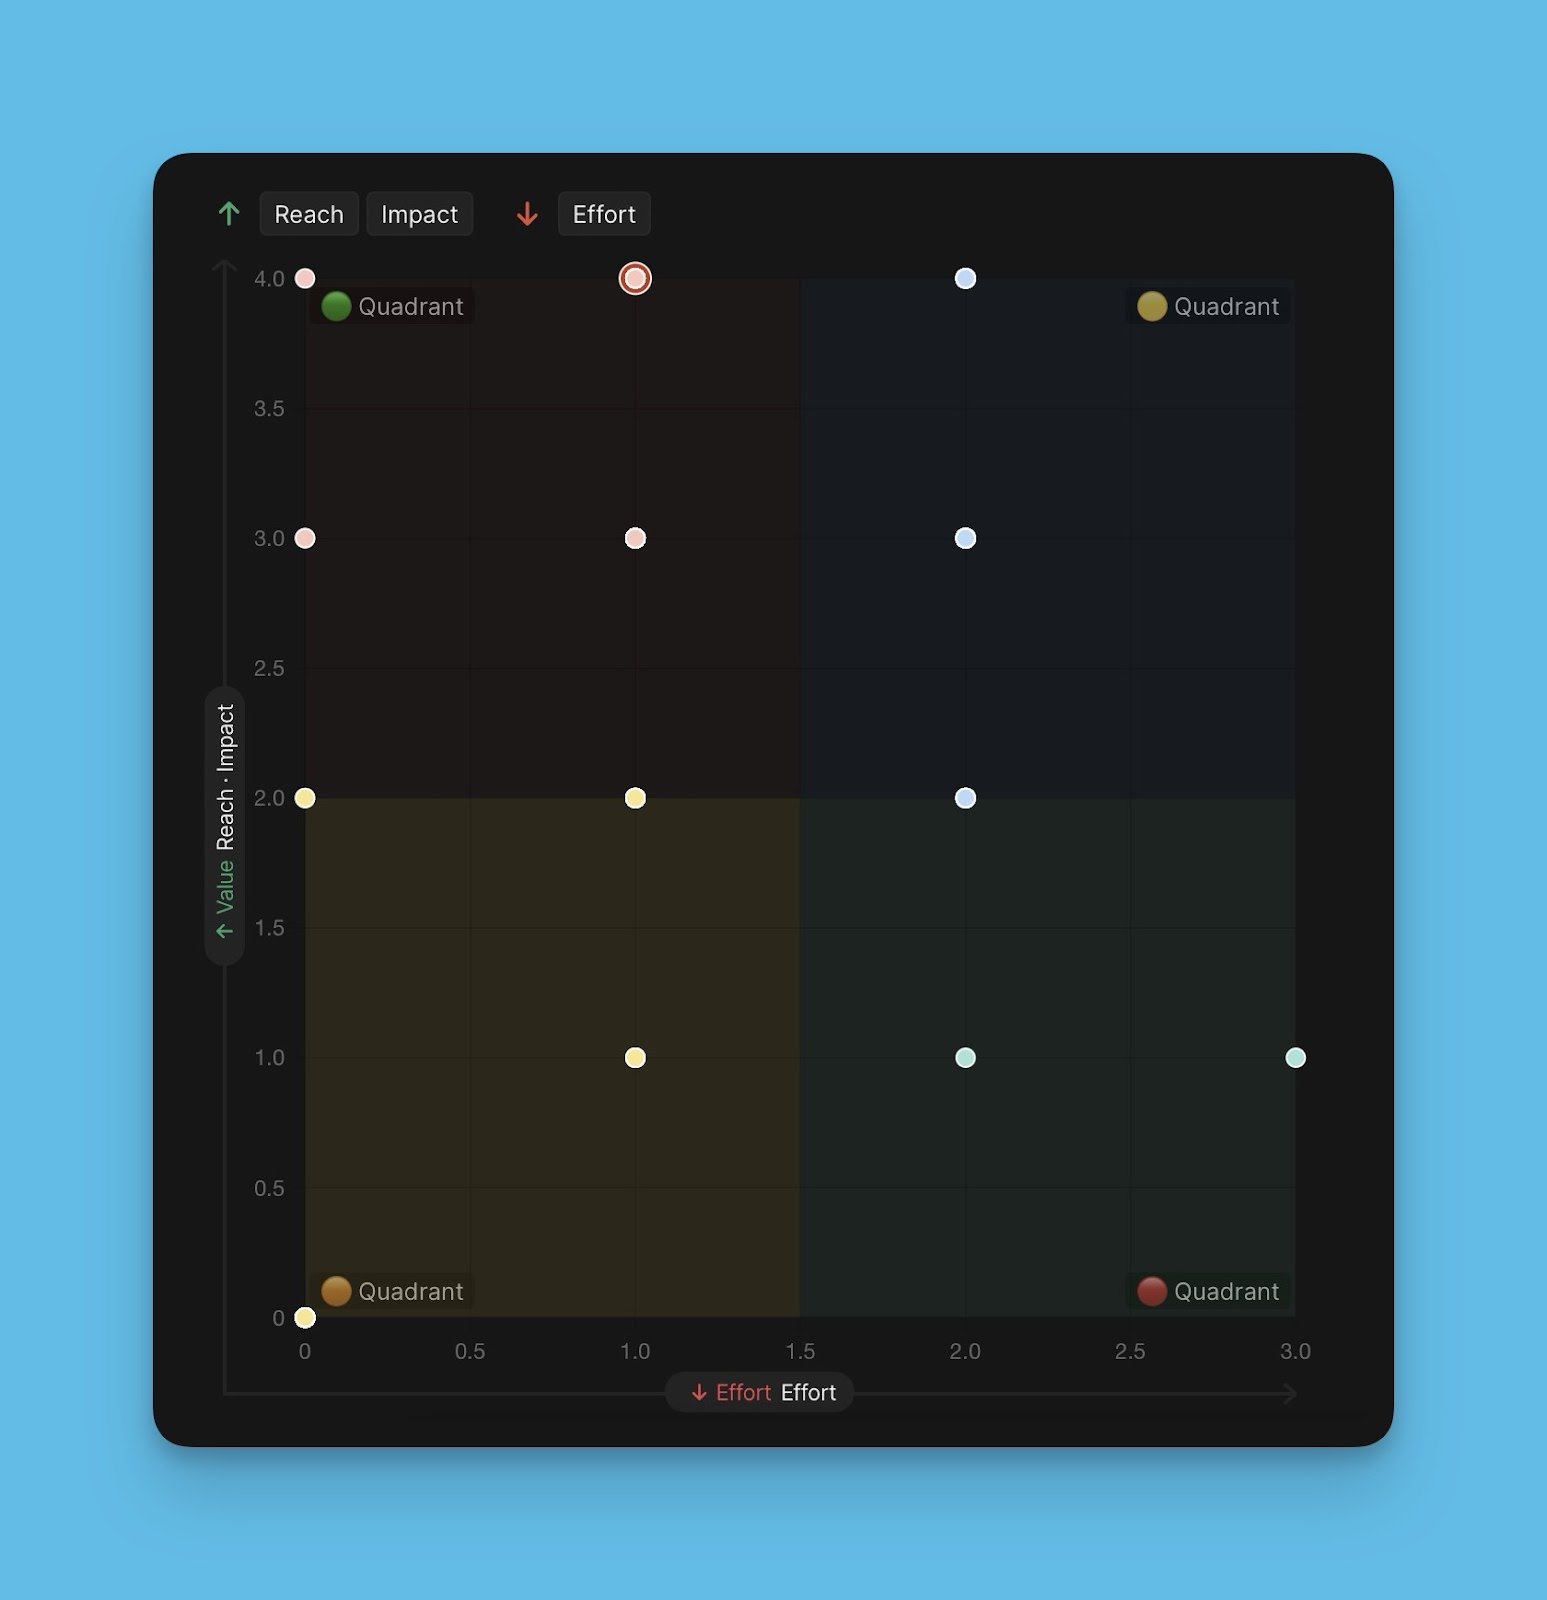
The Chart View
In this view, issues are spread across the matrix diagram in the form of color-coded bubbles. This view gives you a detailed illustration of how the issues are spread out, and where exactly each issue falls on the matrix grid.
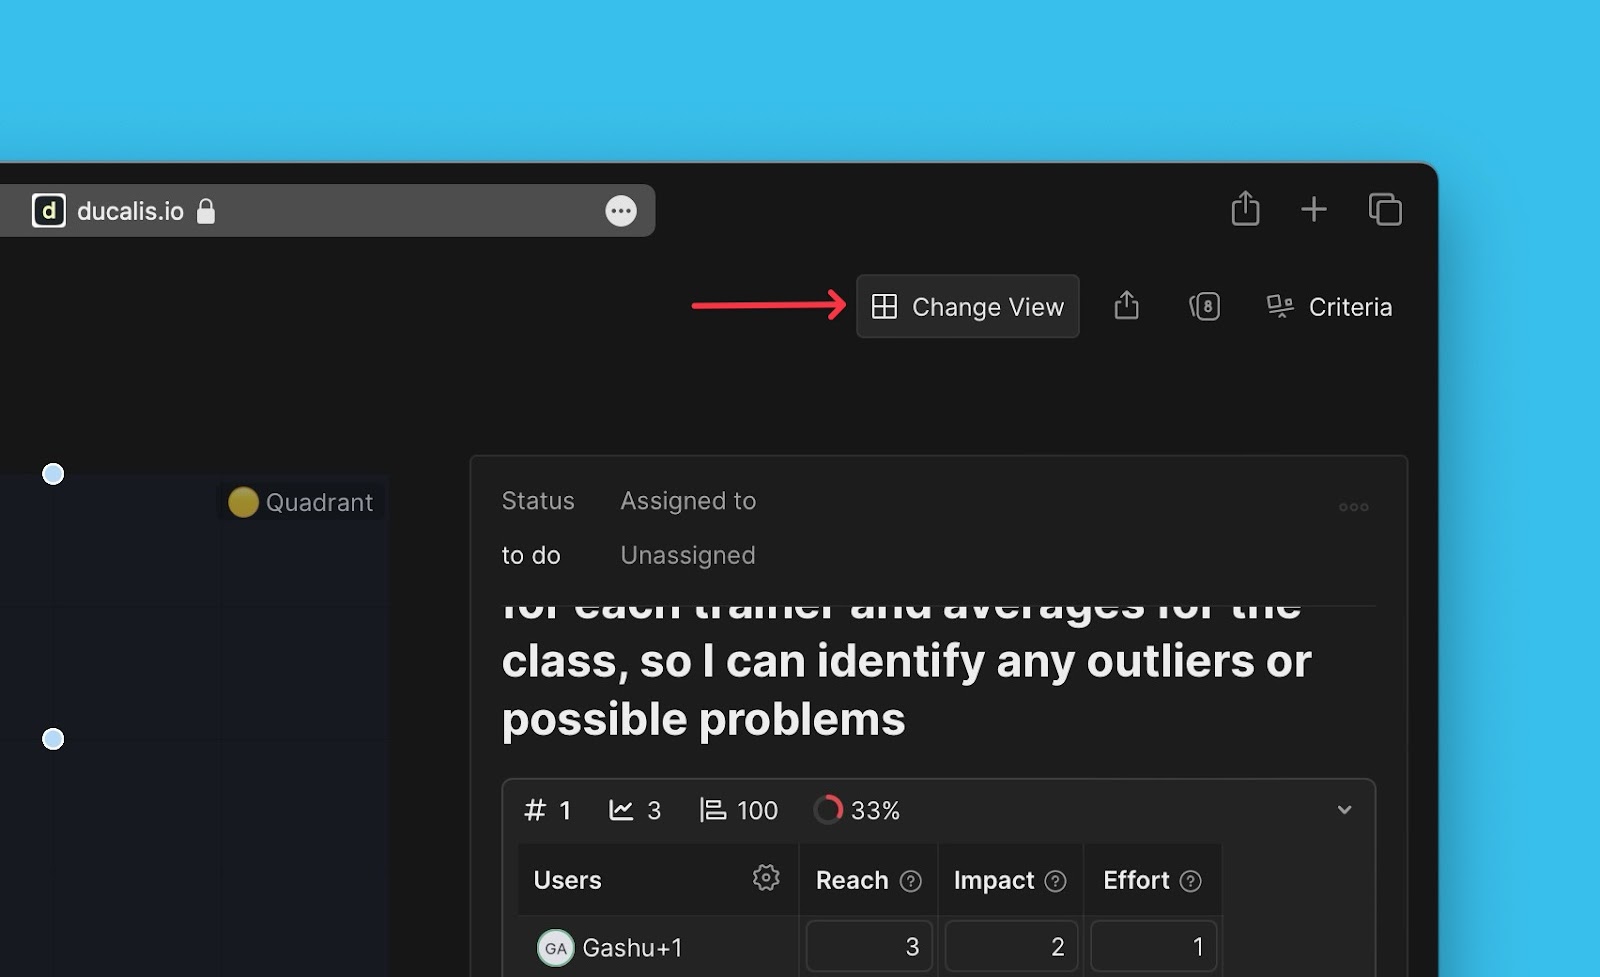
Changing Between The Two Views
To change between views, click on Change View.