Analytics
Track engagement metrics for Ideas you've moved to Done status. View how many Voters read your completed Ideas after you publish them to the Changelog.
When tracking begins
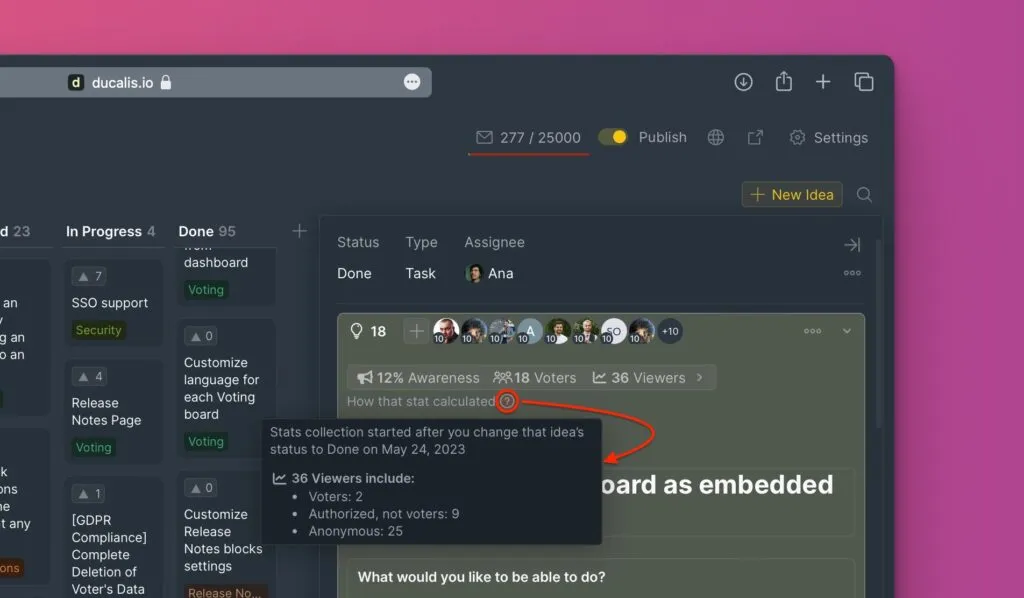
Ducalis starts collecting analytics when you change an Idea's status to Done.
View analytics
-
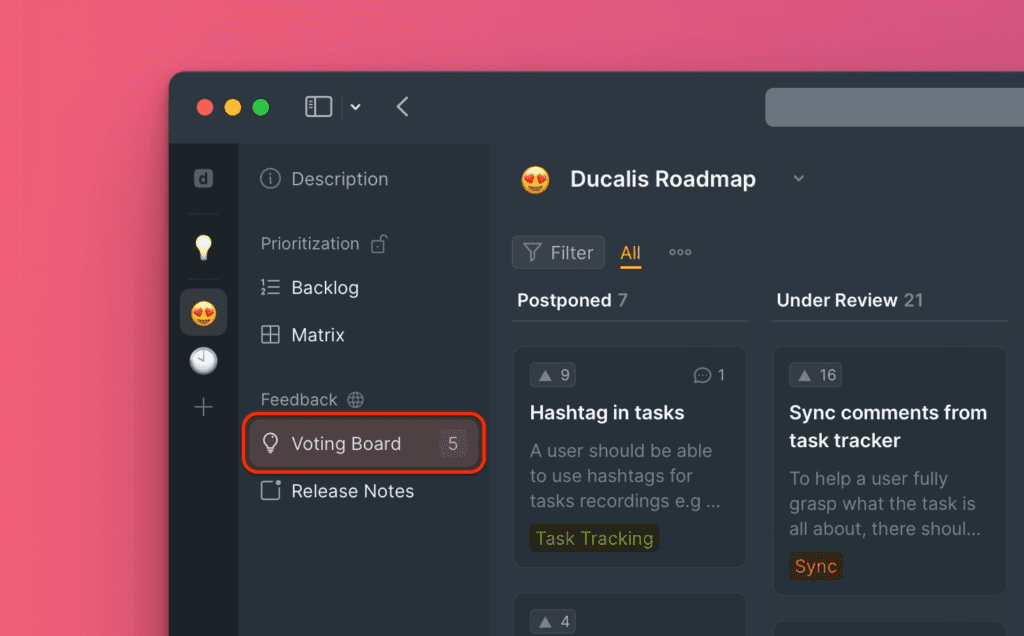
Go to the Voting Board section in your Ducalis Board.
-
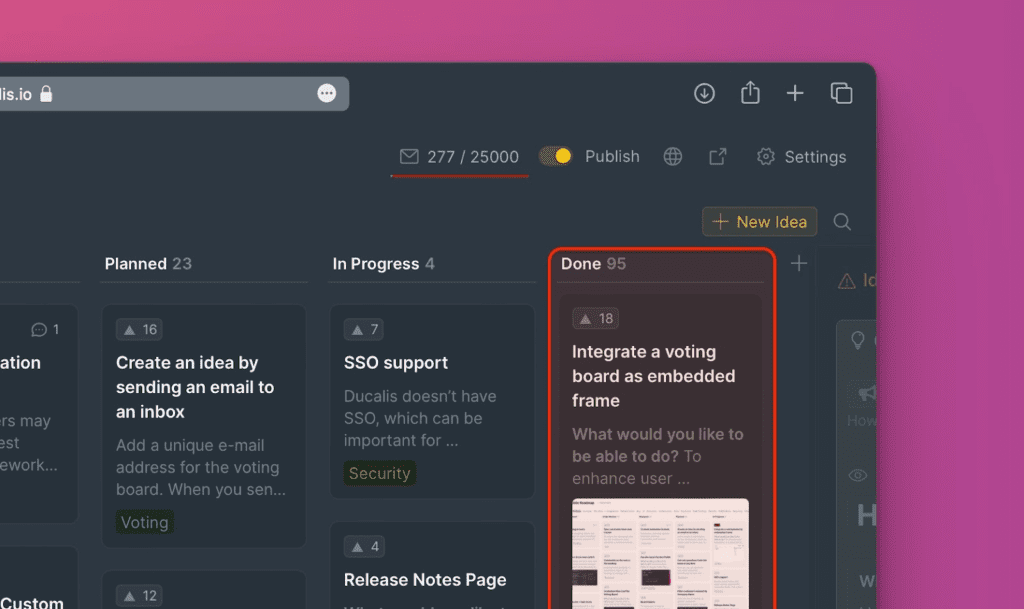
Open the Done column and click the Idea you want to analyze.
-
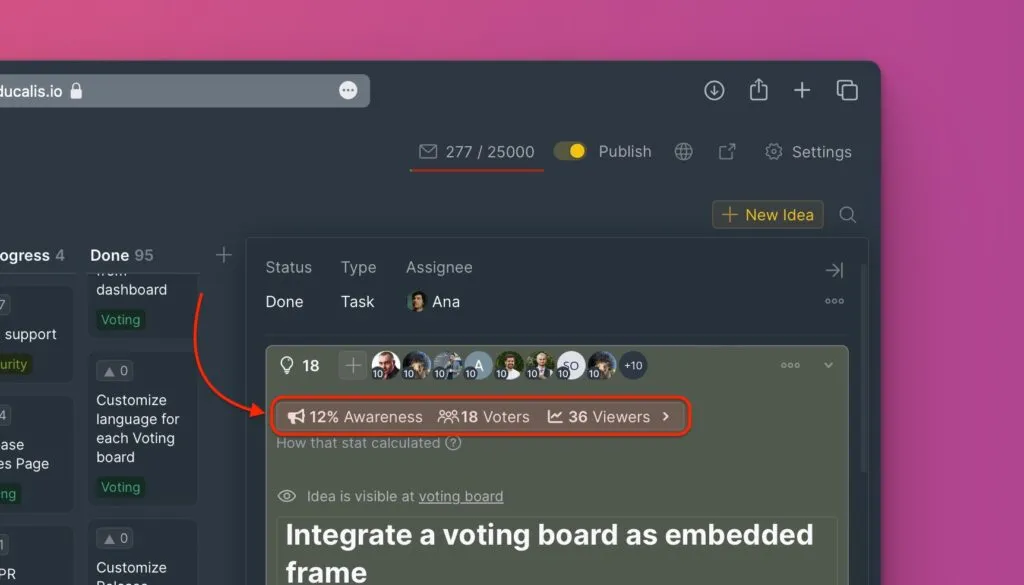
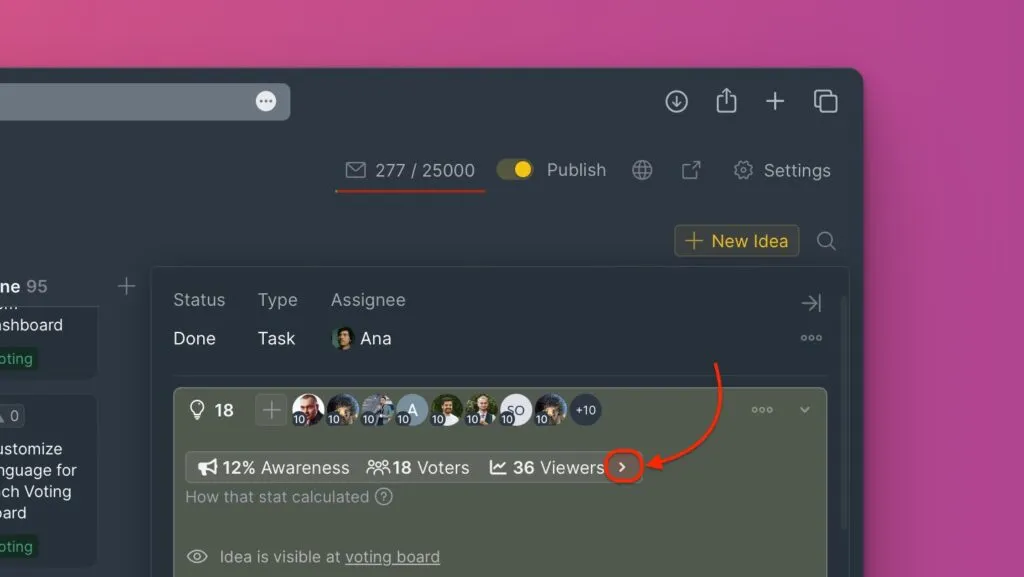
Review the analytics displayed at the top of the Idea card.
- Awareness – percentage of Voters who read the Idea after it moved to Done.
- Voters – total number of Voters who voted for the Idea.
- Viewers – total number of people who viewed the Idea.
-
Click the ? icon to see the breakdown of viewers.
- Readers who voted for the Idea
- Authorized readers who didn't vote
- Anonymous readers
-
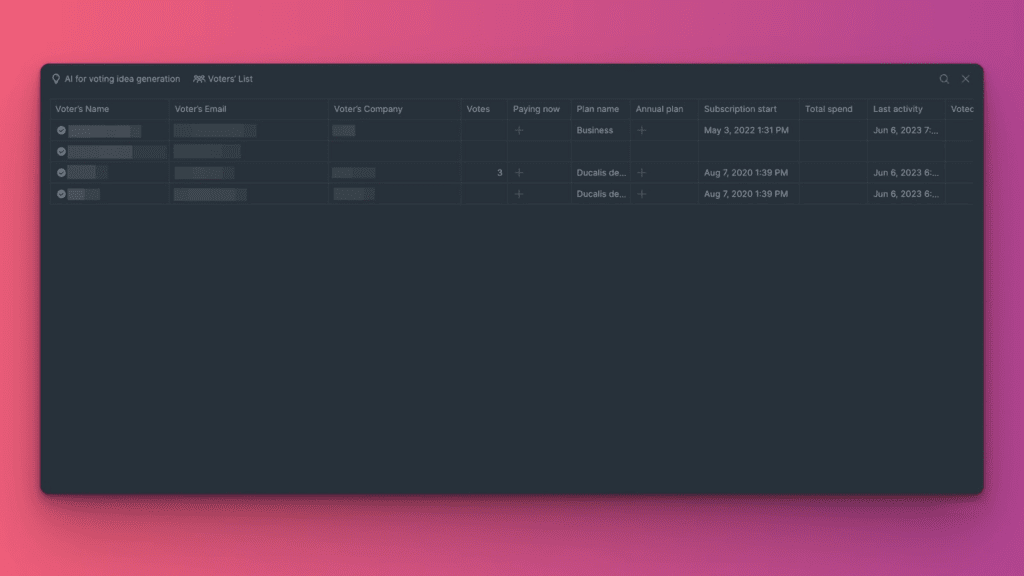
Click the > icon to open the detailed table showing who read the Idea after it moved to Done and who voted for it.
-
Review the detailed user list. A checked circle indicates Voters who read the Idea after you moved it to Done. If you're using the auth widget, you'll see which specific Voters read it and their details.