RICE Framework
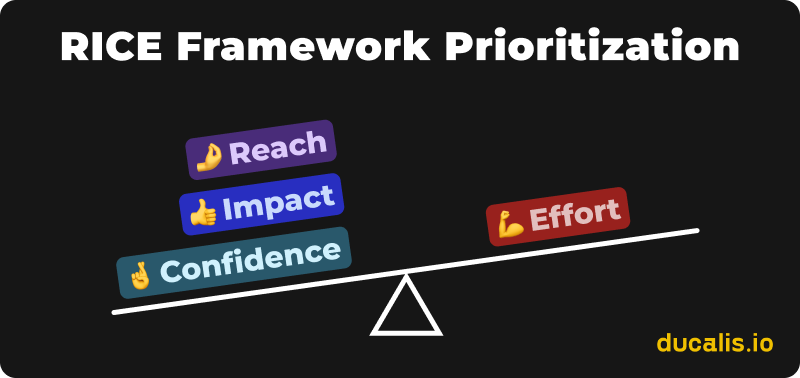
RICE Framework is a scoring model that helps you prioritize projects, features, and hypotheses by evaluating four factors: Reach, Impact, Confidence, and Effort.
What is RICE Score
RICE Framework scores projects based on four criteria:
- Reach - How many people will this affect within a defined period
- Impact - How much will this impact your objective when customers encounter it
- Confidence - How confident are you in your Reach and Impact estimates
- Effort - How much time will this require from your team
The framework helps you identify the most valuable solutions to work on next.
Calculate RICE Score
To calculate the RICE score:
- Multiply Reach × Impact × Confidence
- Divide the result by Effort

Sort your projects by total score in descending order. Higher scores indicate more value per time invested, helping you focus on impactful work while understanding who you'll affect, why, how, and when.
Reach
How many people will this feature affect within a defined period?
Estimate the number of people or events per period using any positive number.
Reach measures how many leads and users your idea will affect. A registration page affects every potential customer, while an advanced feature affects only experienced users.
Impact
How much will this feature impact your objective when a customer encounters it?
Score using:
- 0.25 = Minimal
- 0.5 = Low
- 1 = Medium
- 2 = High
- 3 = Massive
Impact measures influence on a specific goal. Focus on one objective when scoring. Comparing "increases conversion by 2" with "increases adoption by 3" and "maximizes delight by 2" creates meaningless comparisons.
Confidence
How confident are you in your Reach and Impact estimates?
Score using:
- 20% = Moonshot
- 50% = Low Confidence
- 80% = Medium Confidence
- 100% = High Confidence
Confidence reflects the strength of your data. Score 100% only when you have solid backup data. This criterion makes prioritization more data-driven and less emotional.
Effort
How much time will this feature require from the whole team: product, design, and engineering?
Estimate using any positive number representing "person-months."
Effort measures time required for implementation. This completes the Value/Effort balance and helps surface Quick Wins.
Download free RICE template
Download free RICE template:
8 tips to improve RICE Framework
These recommendations are simple and actionable. You can implement a few or all of them—implementing all delivers maximum benefits.
1. Specify criteria meaning for your product
RICE criteria descriptions are intentionally general. Impact asks "How much will this impact the objective?" but doesn't specify which objective. Without customization, you must constantly remember your goal, slowing estimation. Your mind will wander, and you'll assign high or low Impact scores to tasks affecting different objectives.
If you have formulated OKRs or business metrics, add them to the description. For customer retention focus:
How much will this feature impact customer retention? Will it increase the percentage of leads converting to regular customers? Will users return to the product more often?
You can rename Impact to "Retention"—no one will judge you.
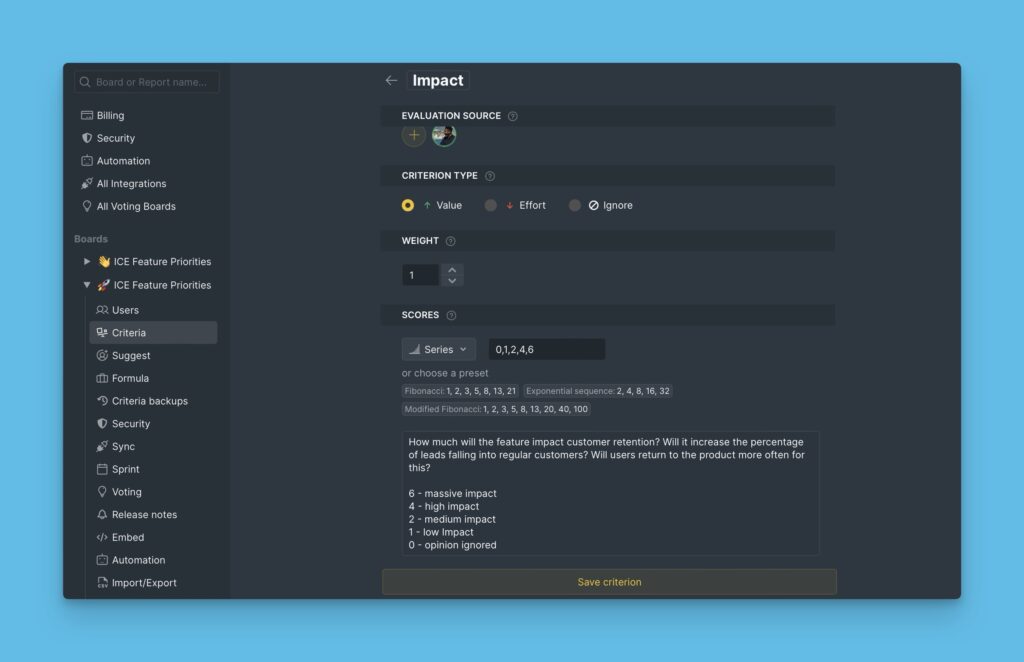
The same applies to Effort. "Person-months" suits massive projects, but rapid-growth teams benefit from "person-days," "person-weeks," or "person-hours."
Templates:
Customizable RICE template for feature prioritization
Customizable RICE template for marketing prioritization
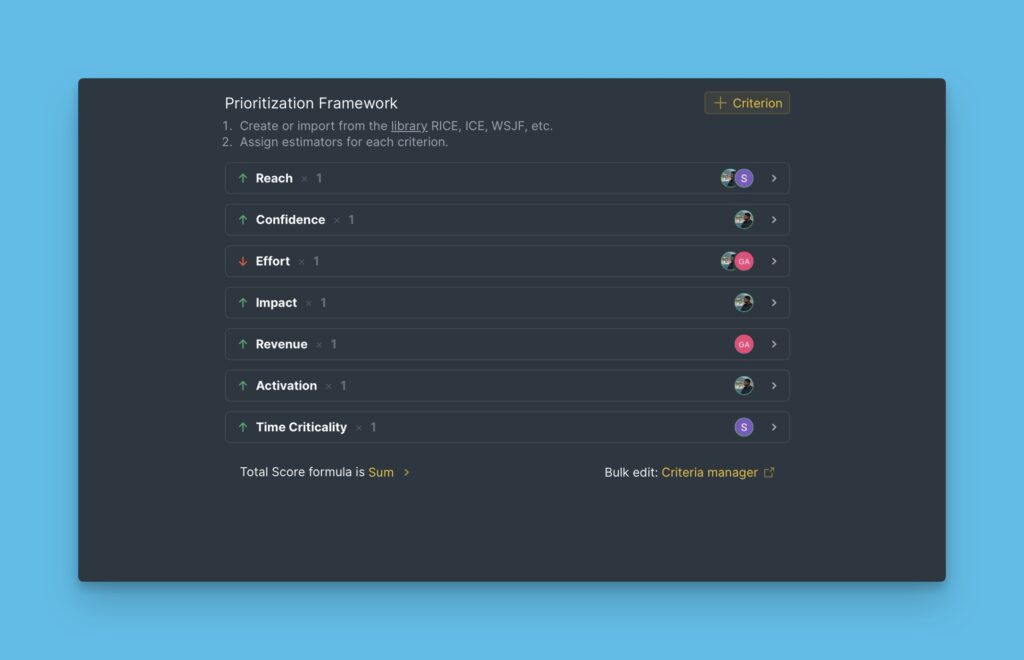
2. Add custom factors for your objectives
You likely have multiple objectives, not just one metric to push. Impact alone can't capture all business dimensions.
Add other values for comprehensive evaluation:
- Business metrics - Revenue, Customer Acquisition Cost
- Product metrics - Activation, Retention
- Negative metrics - Risks, Promotion Costs
Frameworks provide an excellent starting basis. Customization doesn't break prioritization—it makes prioritization work better.
3. Unify score scales to prioritize faster
RICE criteria use inconsistent scales:
- Reach - Actual user metrics
- Impact - Subjective numbers
- Confidence - Percentages
- Effort - Development days
This diversity slows estimation and creates inconsistency.
Gathering data for Reach takes time, and the numbers remain approximate anyway. Prioritization should help you decide quickly, adding velocity to decision-making. Perfect accuracy won't guarantee perfect priorities.
Use the same scale for all criteria. Popular sequences include:
- 0-3 scale
- 0-10 scale
- Fibonacci - 1, 2, 3, 5, 8
- Exponential - 1, 2, 4, 6, 8
Choose one sequence and stick to it. Scoring all criteria with the same numbers repeatedly, then seeing results, develops reliable intuition for estimation.
To build reliability faster and reduce subjectivity, add score meanings to criteria descriptions:
Reach - How many people will this feature affect within a defined period?
- 1 = less than 100 people
- 2 = 100-300 people
- 3 = 300-600 people
- 5 = 600-900 people
- 8 = ~1,000+ people
4. Collect diverse opinions for expert assessment
Solo estimation has drawbacks.
First, you miss expert input. Engineers accurately estimate development time. PMs better predict user impact. Stakeholders understand business impact.
Second, having teammates estimate criteria makes them more conscious about their tasks. Understanding user and business needs affects daily decision-making, creating team clarity and shared experience.
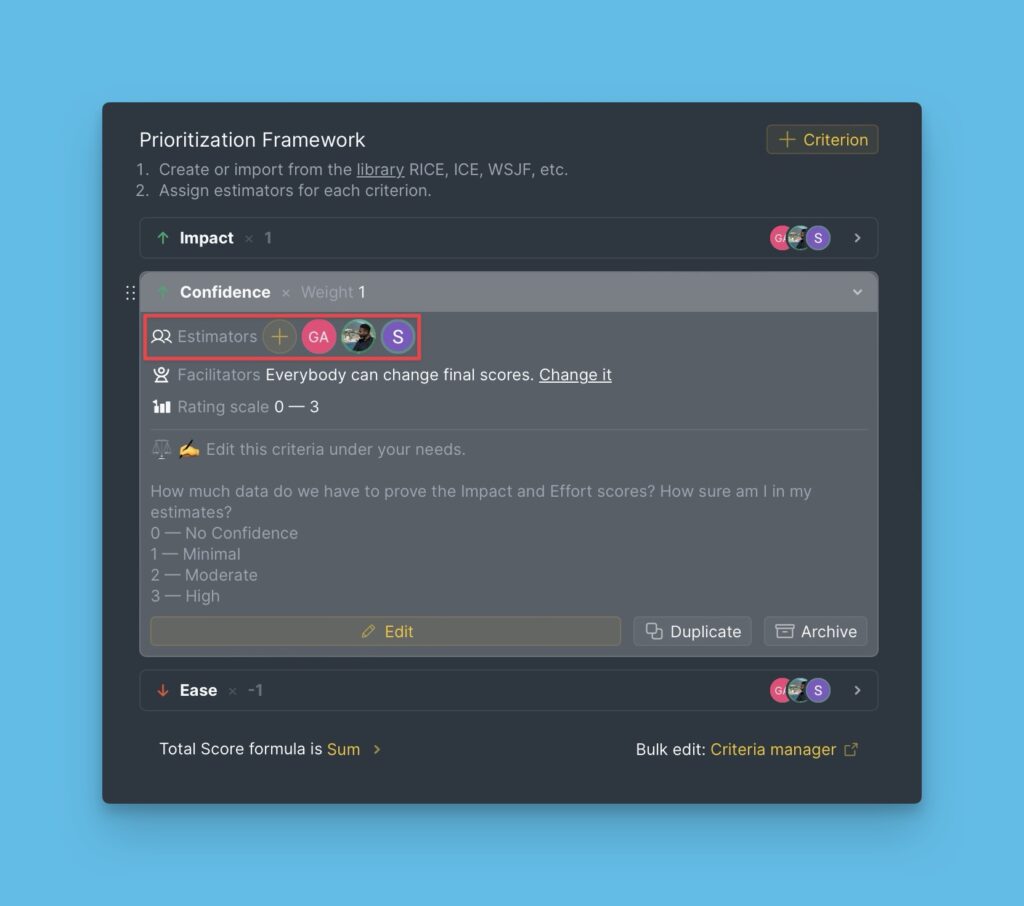
Divide criteria among team members according to their expertise. Evaluate some criteria collaboratively.
5. Check score scatter for estimation clarity
After collaborative scoring, compare teammates' scores. You may discover someone:
- Has a unique perspective other team members haven't considered
- Doesn't understand the project or the objective behind the criteria
Sometimes all scores differ, indicating the team doesn't understand the project or criteria. This exercise reveals gaps in team alignment around goals. You need shared understanding—when building a rocket, you want a missile, not a flying saucer.
Discuss only projects or criteria with scattered scores to spot problems. No need to discuss the entire backlog together. This saves time on coordination work.
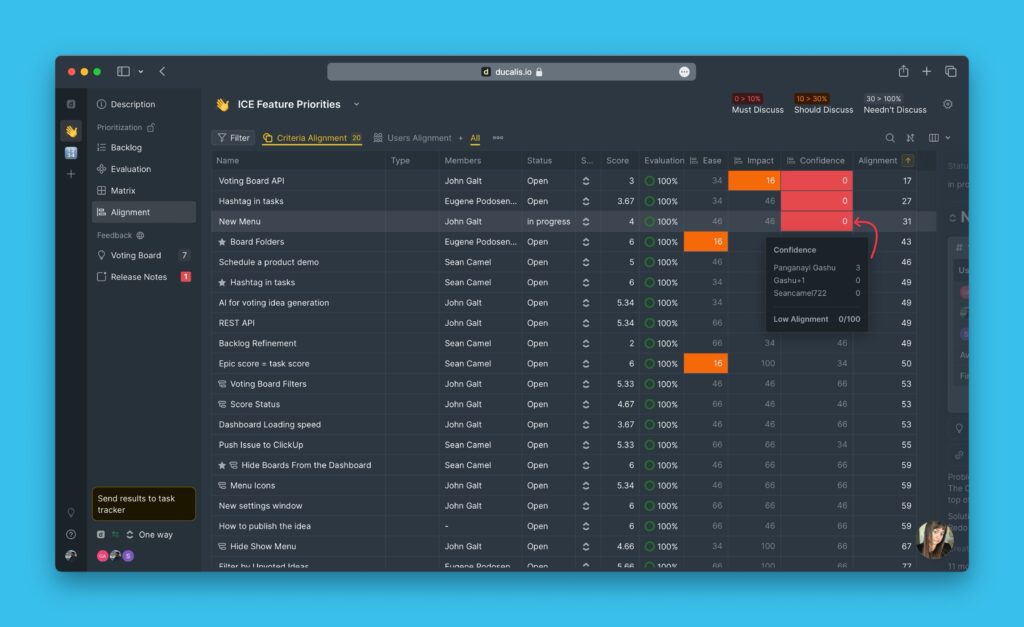
Ducalis highlights tasks and criteria with wide score variation for discussion.
6. Use matrix to visualize project influence
A 2×2 matrix helps visualize your product backlog when deciding what to develop next. Ranked lists are useful, but where do Quick Wins end and Major Projects begin? Distributing projects into four quadrants improves sprint planning by visually dividing the backlog into four categories based on speed and significance of results.
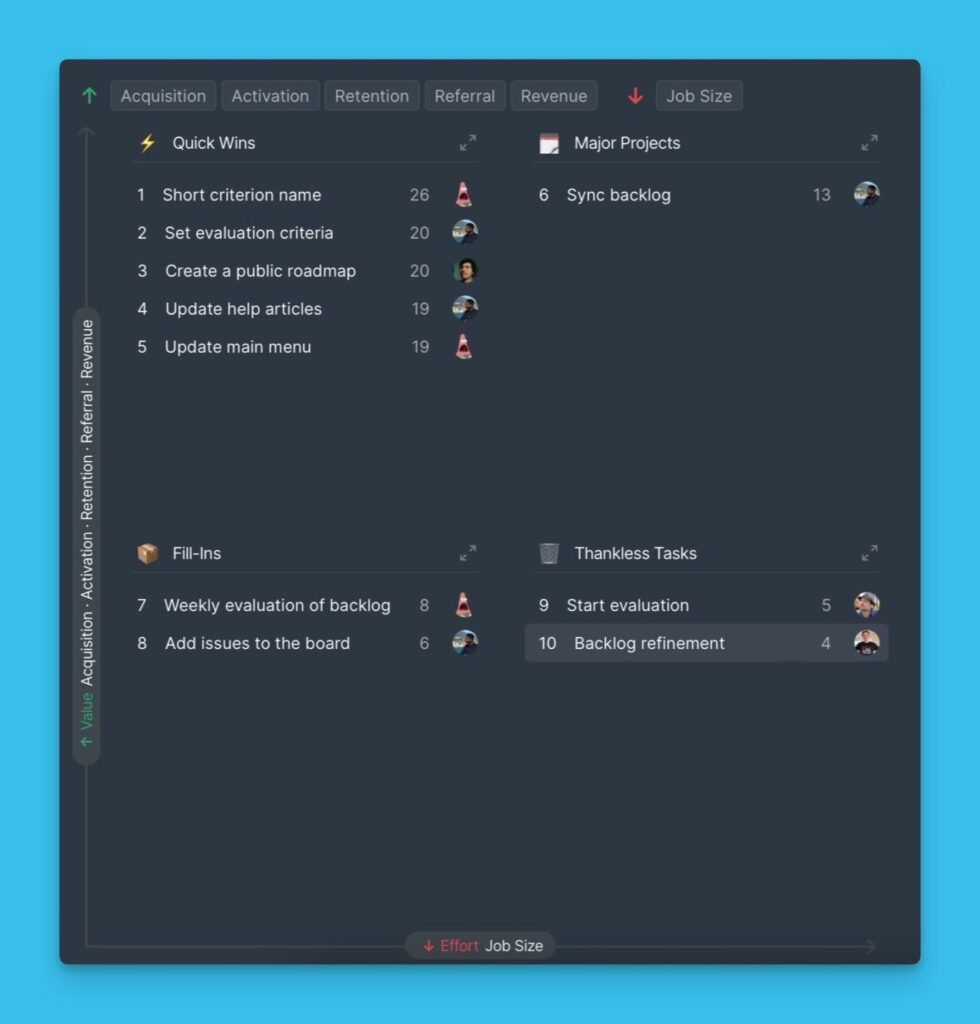
Use both list and matrix priority views to find the best projects.
Estimating multiple positive criteria and using matrix filters helps you surface low-hanging fruit for different objectives. This is useful when juggling and growing multiple metrics simultaneously. You can pick Quick Wins for Activation and Retention while ensuring they also benefit Revenue.

Evaluate all essential criteria and filter those needing the most focus at a particular time or when finding tasks that push a specific metric.
7. Discuss priorities for informed decision-making
When your team knows their OKRs, has scored future projects, resolved disagreements, and the priorities list is ready, it's time to decide what to work on next. This doesn't mean simply taking top projects and moving forward.
During sprint planning, review priorities again and state which projects are best to ship. Each team member should explain: "I'm implementing the X project because the results will impact Y customers and influence Z objective"—not just "I'll do this because it's at the top."
Understanding what the team is doing, who for, and why is the key to making the right decisions—and thus, solid growth and development.
8. Re-evaluate projects to update relevance
We once heard of a task that's been backlogged for nine years. Don't want to repeat the story? Re-evaluate your backlog regularly.
Priorities change quickly, sometimes overnight. A project may not reach the top initially but becomes valuable in a few sprints. If you don't want to lose great ideas at the bottom of your backlog, reassess them over time according to new circumstances.
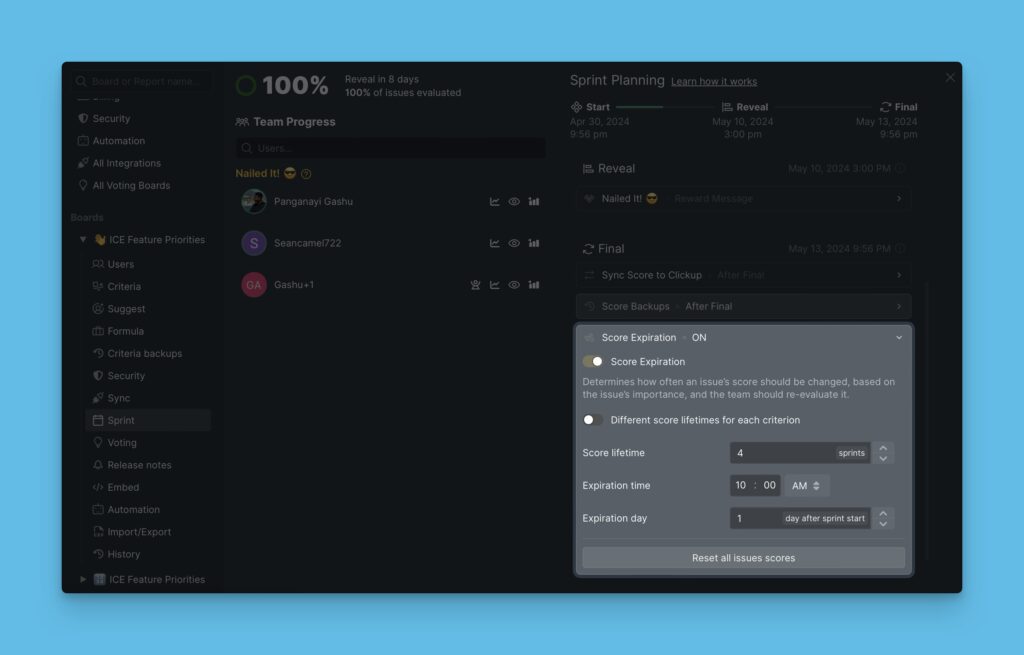
Set up automatic score clearing after several development sprints.
Re-evaluation also helps find backlog trash. If a project gets low scores cycle after cycle, that's a red flag—rethink the idea to make it more valuable or delete it.
Sign up at Ducalis, connect 2-way sync with your task tracker, automate your prioritization process, and create a team evaluation habit.