Passo 5. Ver e Analisar Resultados
Visualize e analise os resultados da priorização para identificar quais Itens a sua equipa deve abordar primeiro. Os resultados aparecem na página Backlog (lista ordenada) e na página Matrix (quadrantes visuais).
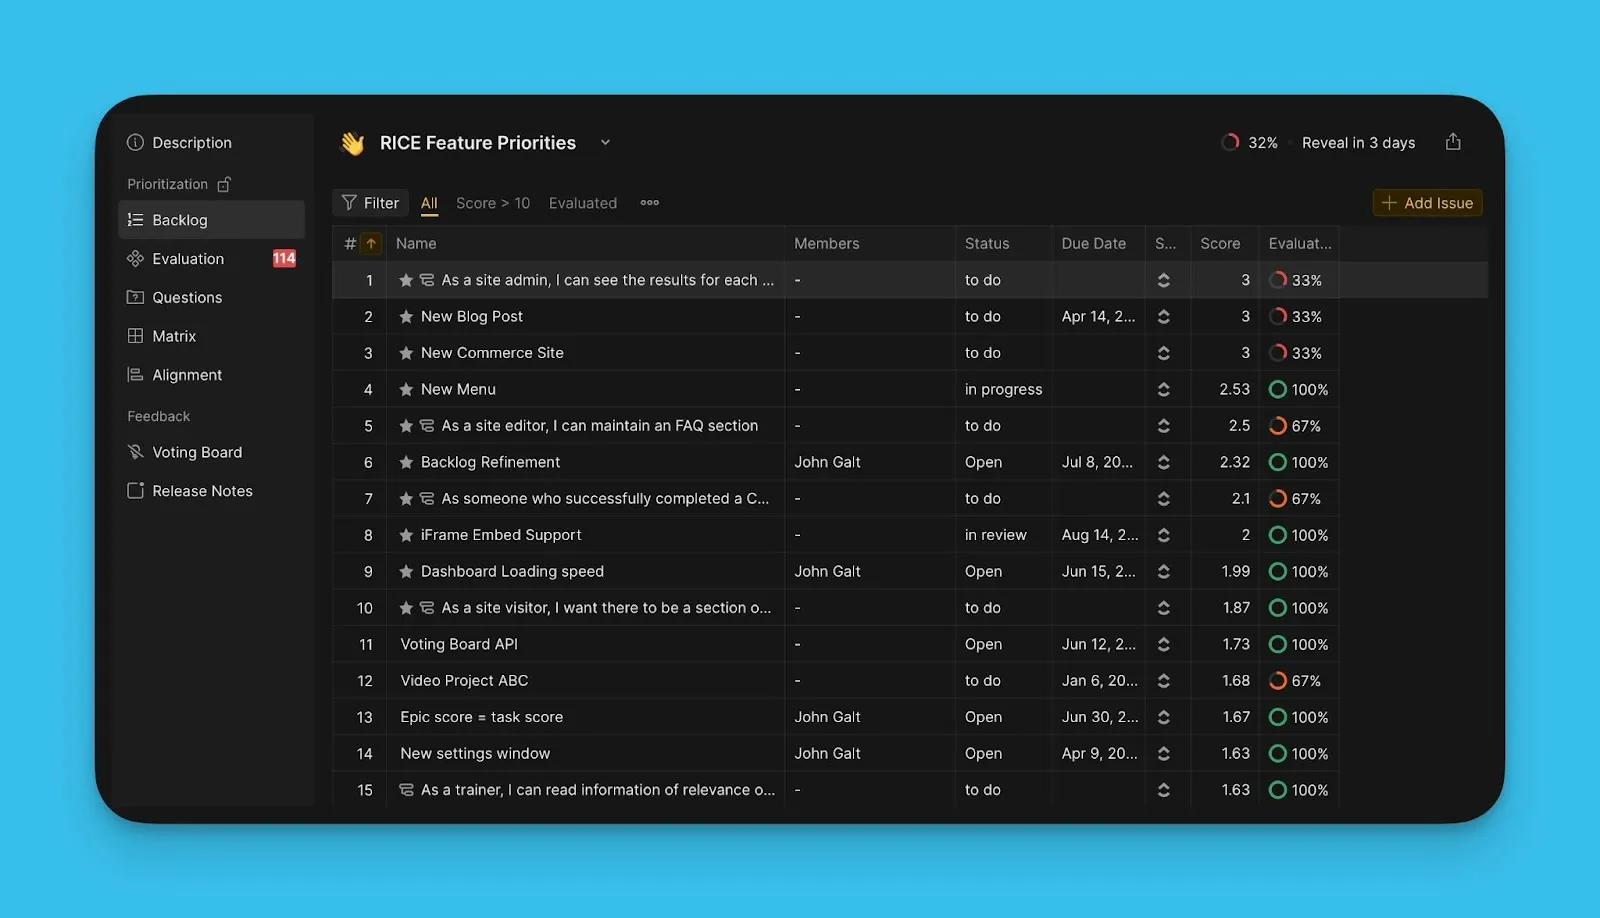
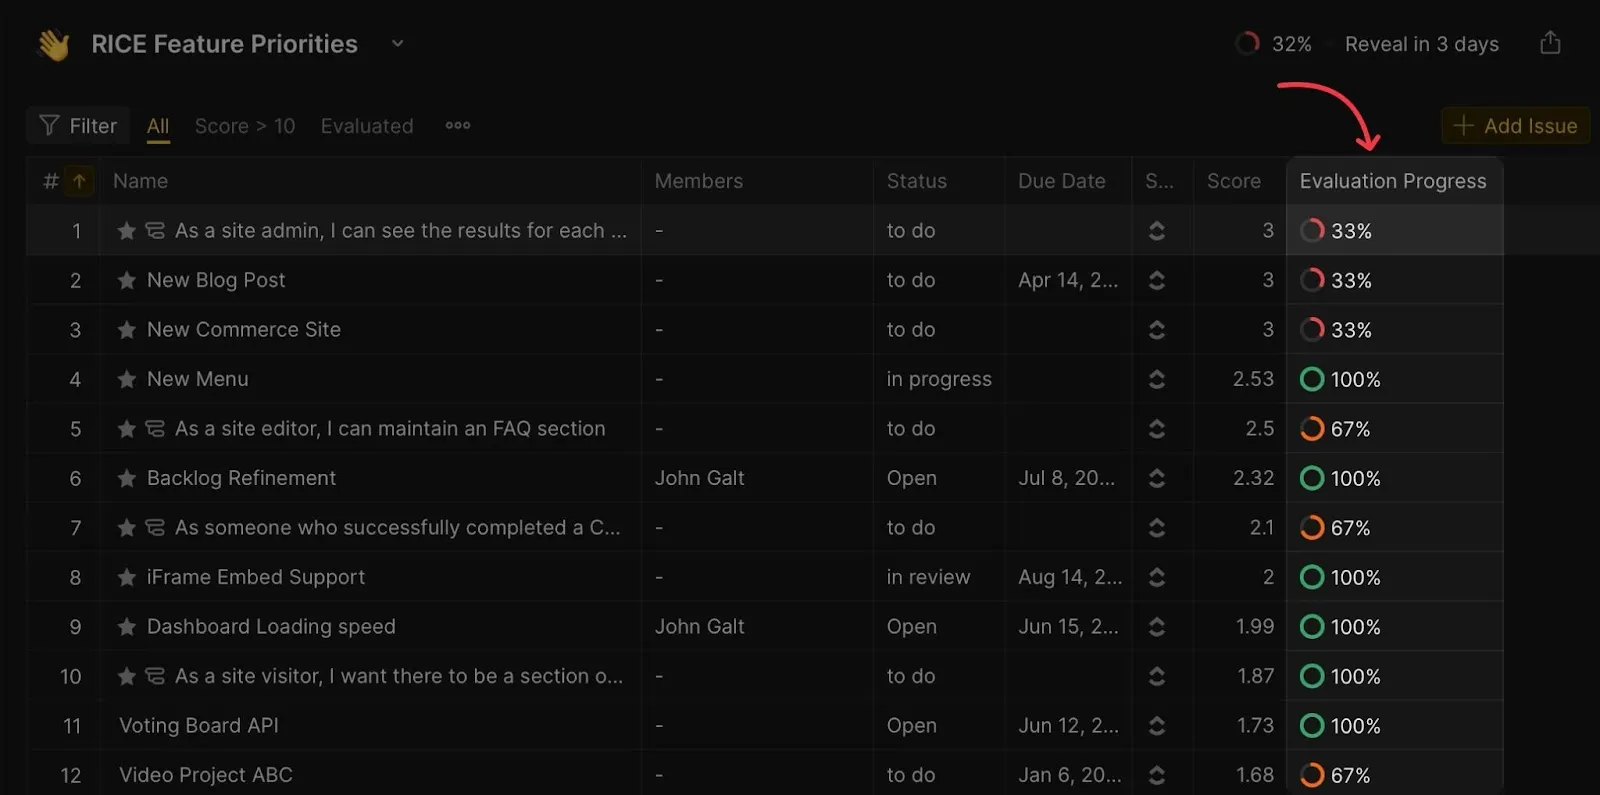
Página Backlog
A página Backlog mostra todos os Itens ordenados por pontuação de prioridade. O Item de maior prioridade aparece no topo.
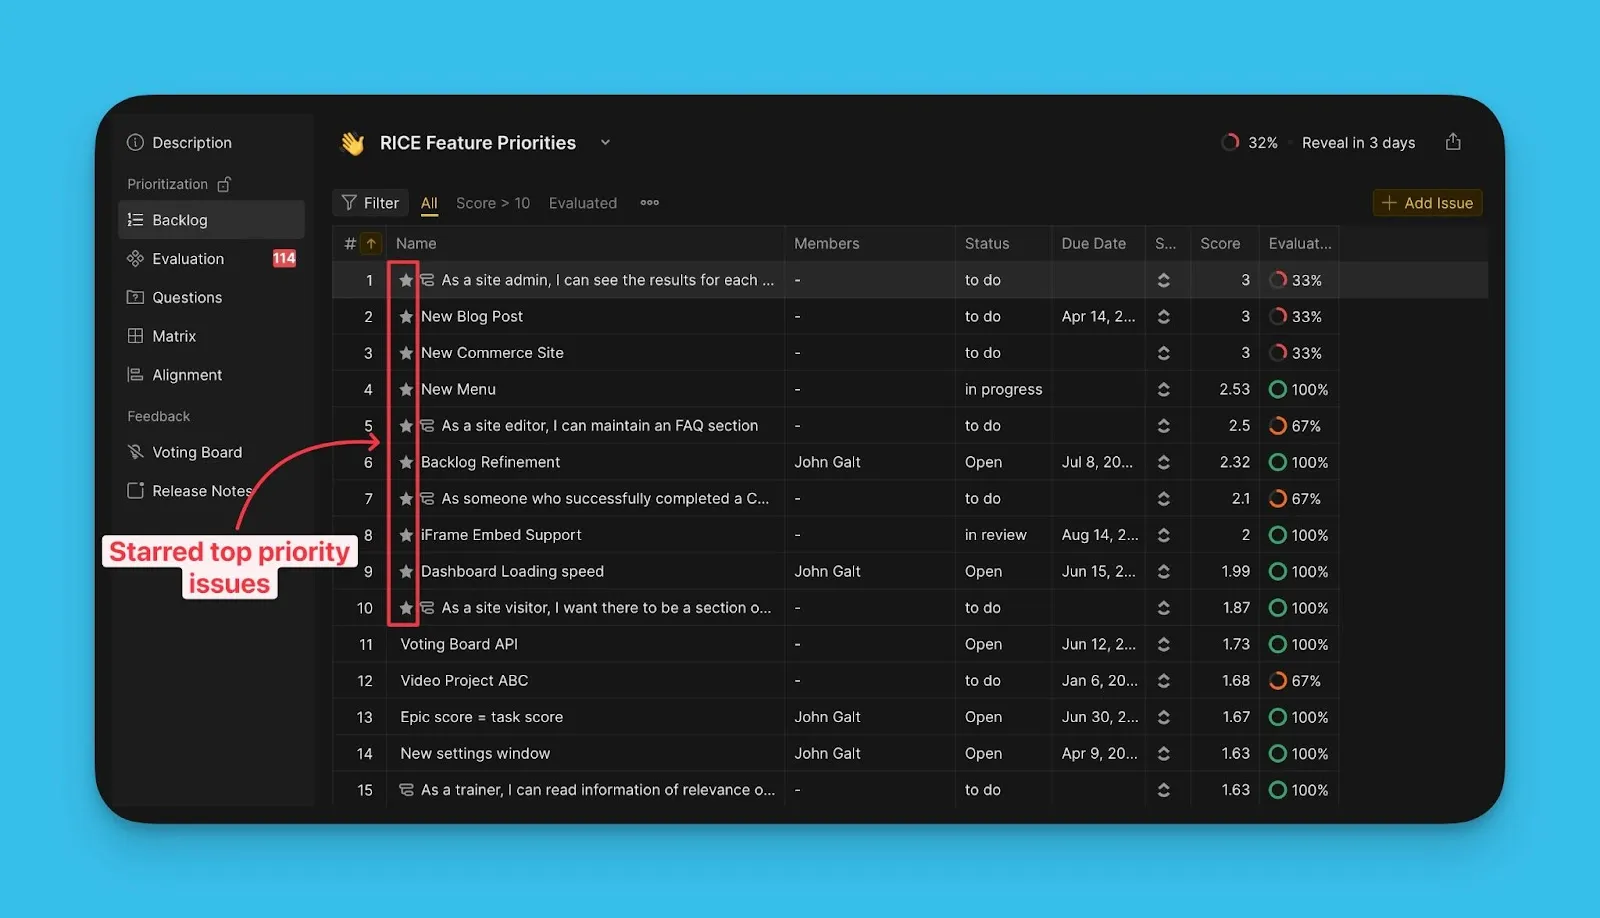
Os Itens de maior prioridade são destacados com estrelas. Pode definir quantos Itens aparecem na sua lista de principais prioridades com base na capacidade de Sprint da sua equipa.
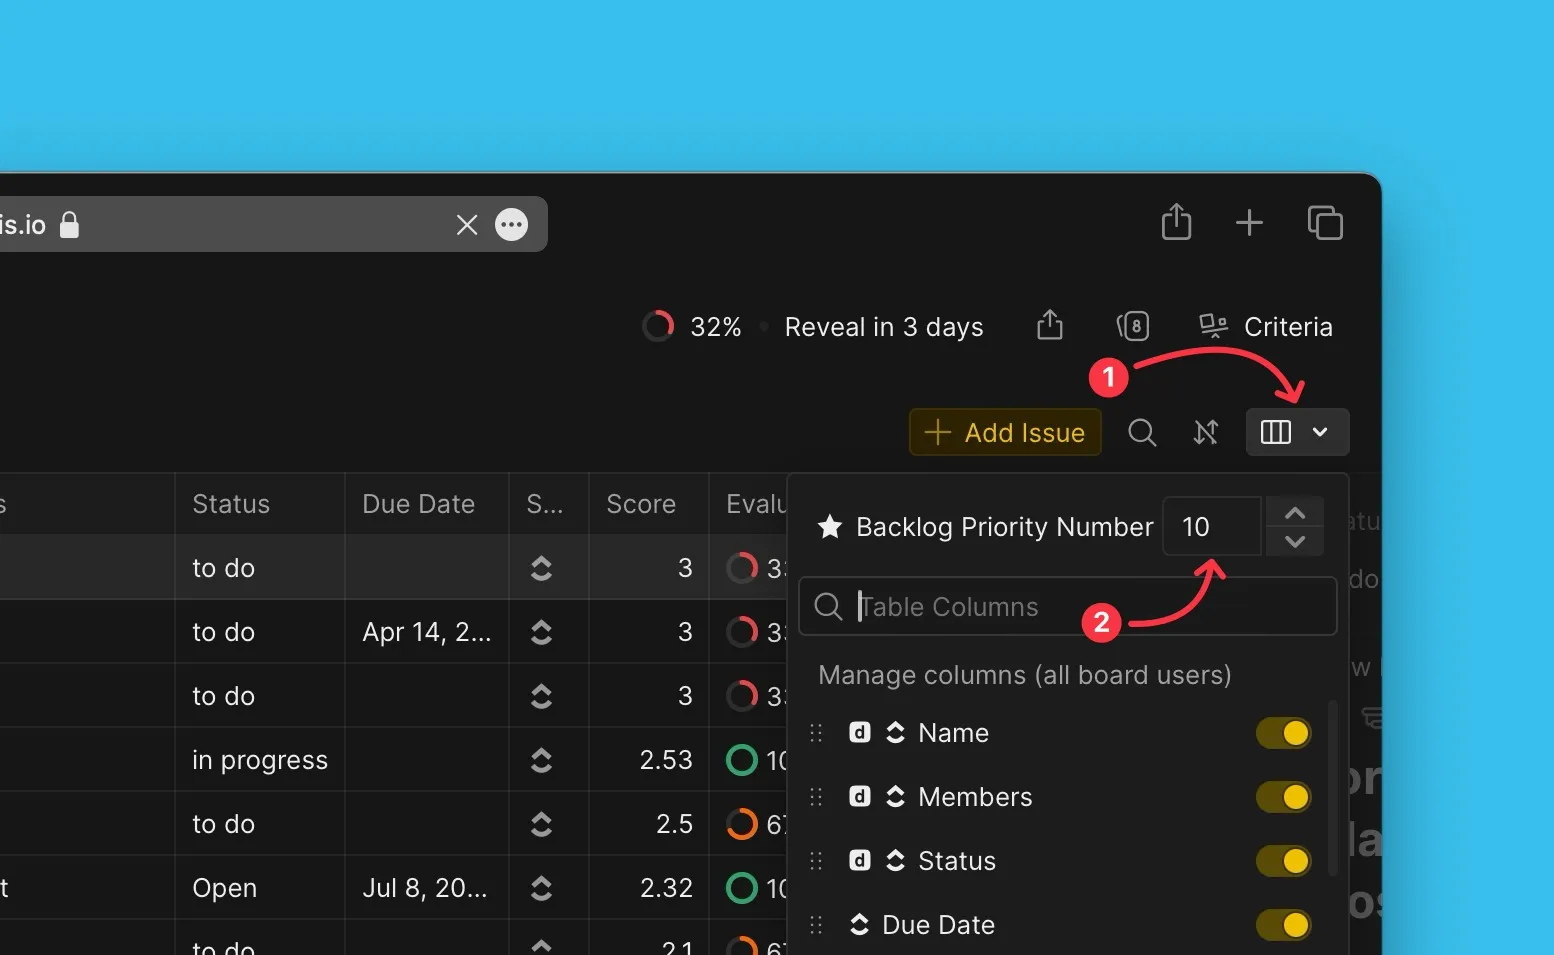
Definir número de principais prioridades
-
Aceda às definições de personalização da tabela.
-
Introduza o número de Itens que pretende na sua lista de principais prioridades.
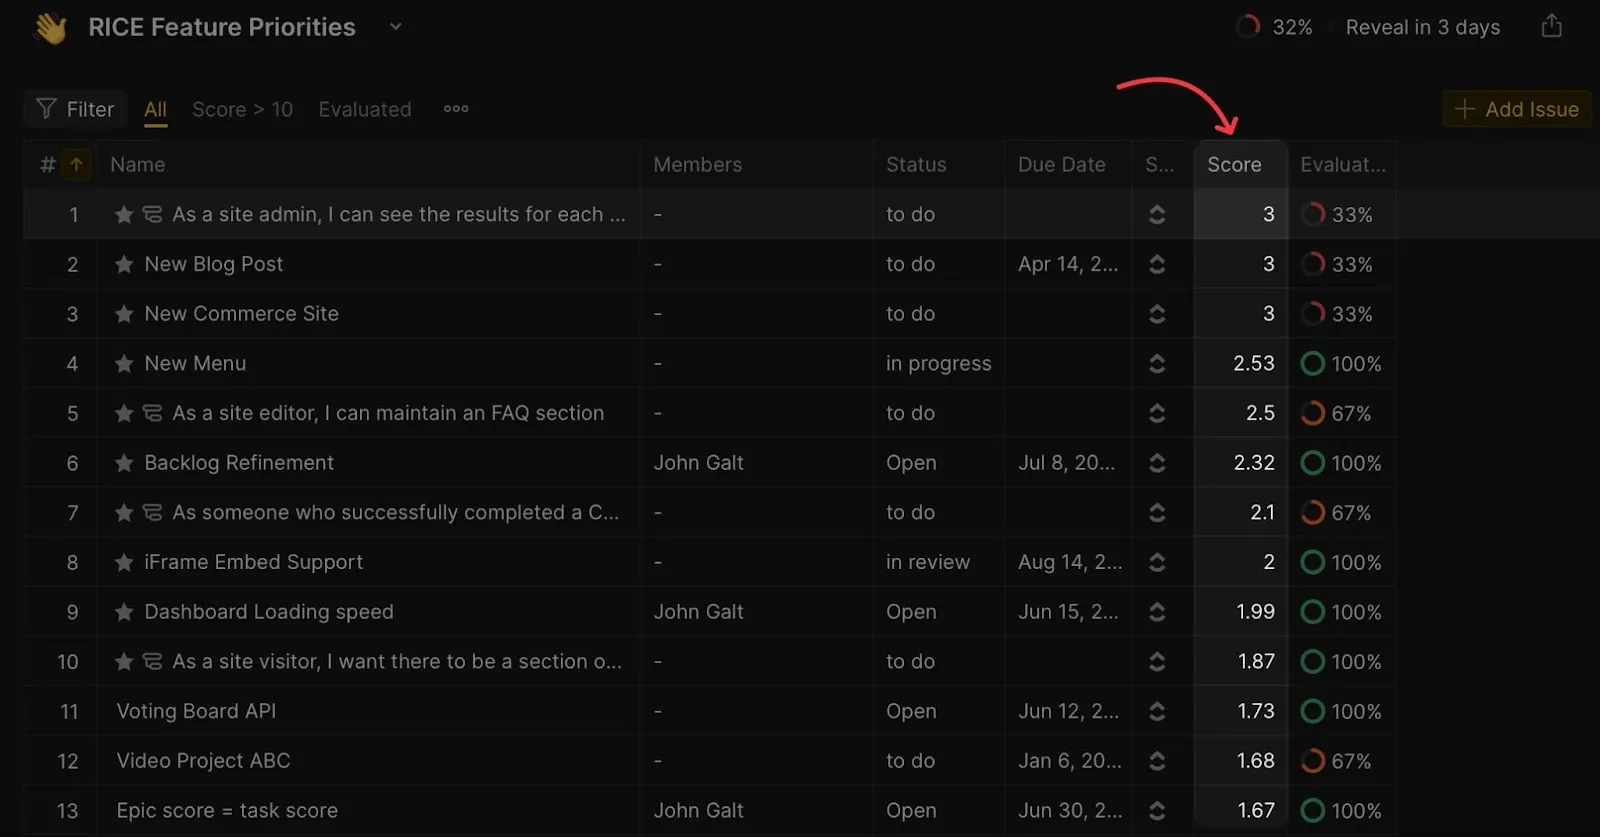
Ver pontuações
A coluna Scores (Pontuações) mostra a Pontuação Final de cada Item, com a pontuação mais elevada no topo.
Ver progresso da avaliação
A coluna de progresso da Avaliação mostra a percentagem de Estimadores que avaliaram cada Item.
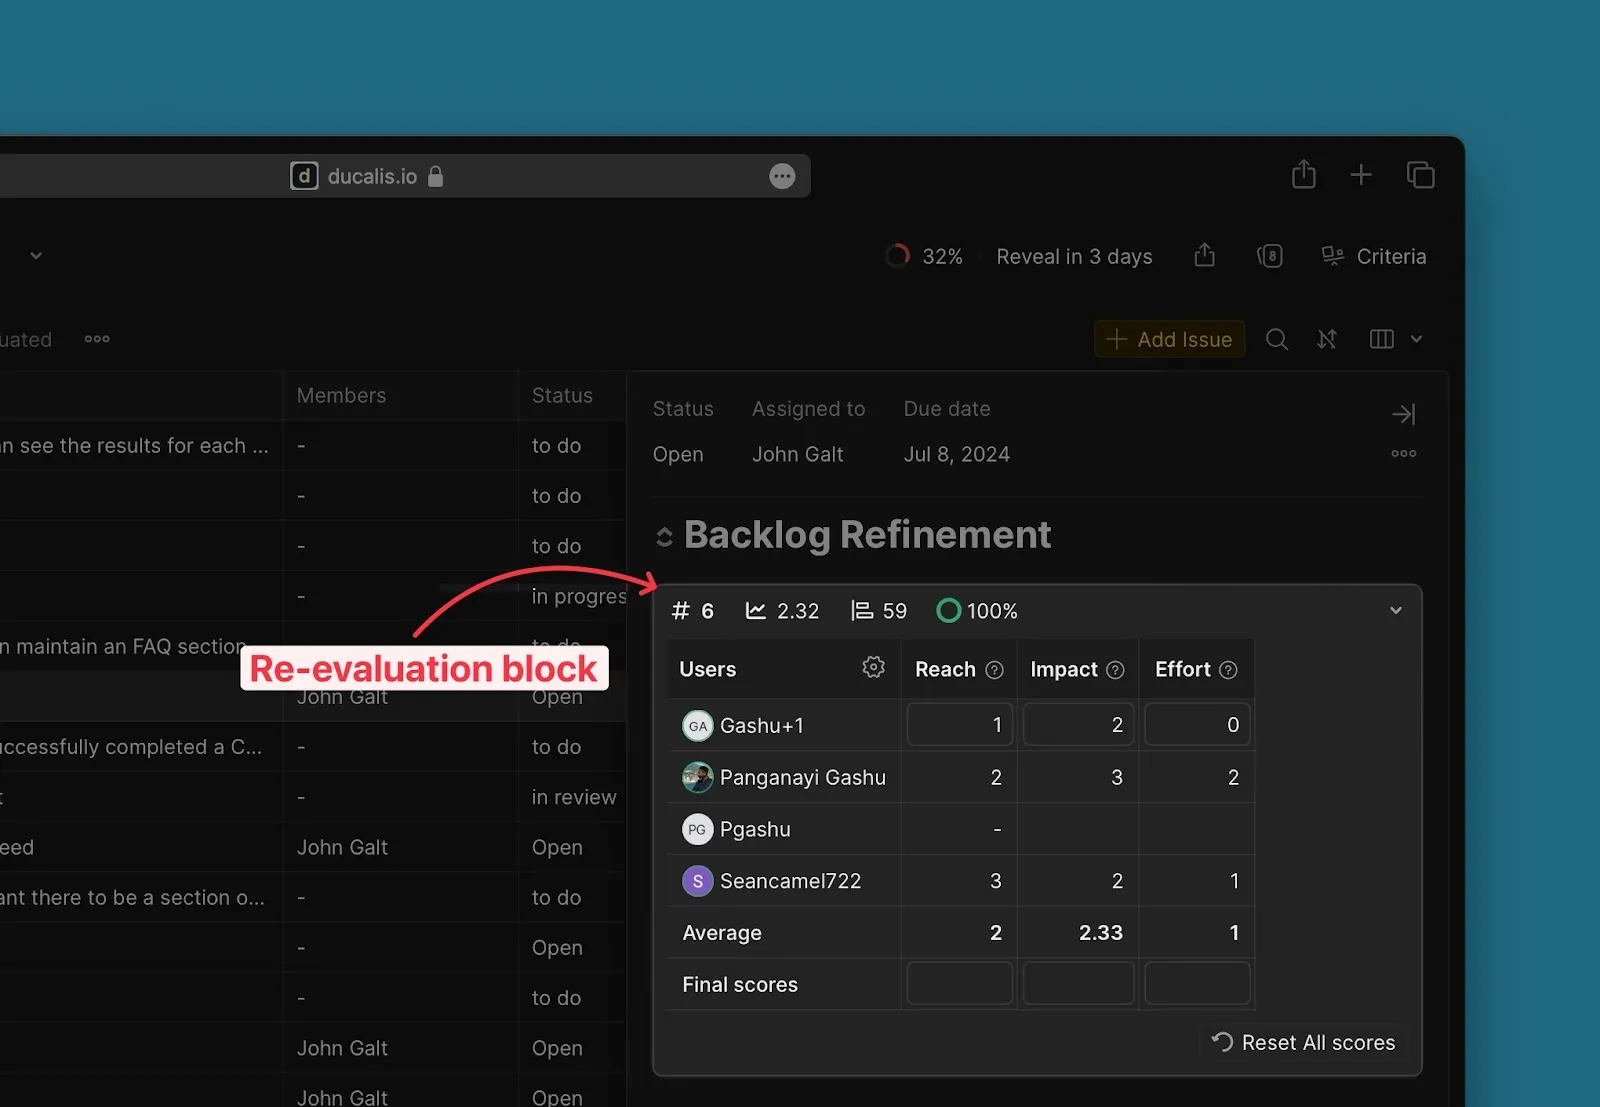
Ver pontuações detalhadas por Critério
Expanda qualquer cartão de Item para ver o bloco de reavaliação. Este mostra as suas pontuações e as pontuações dos seus colegas de equipa para cada Critério.
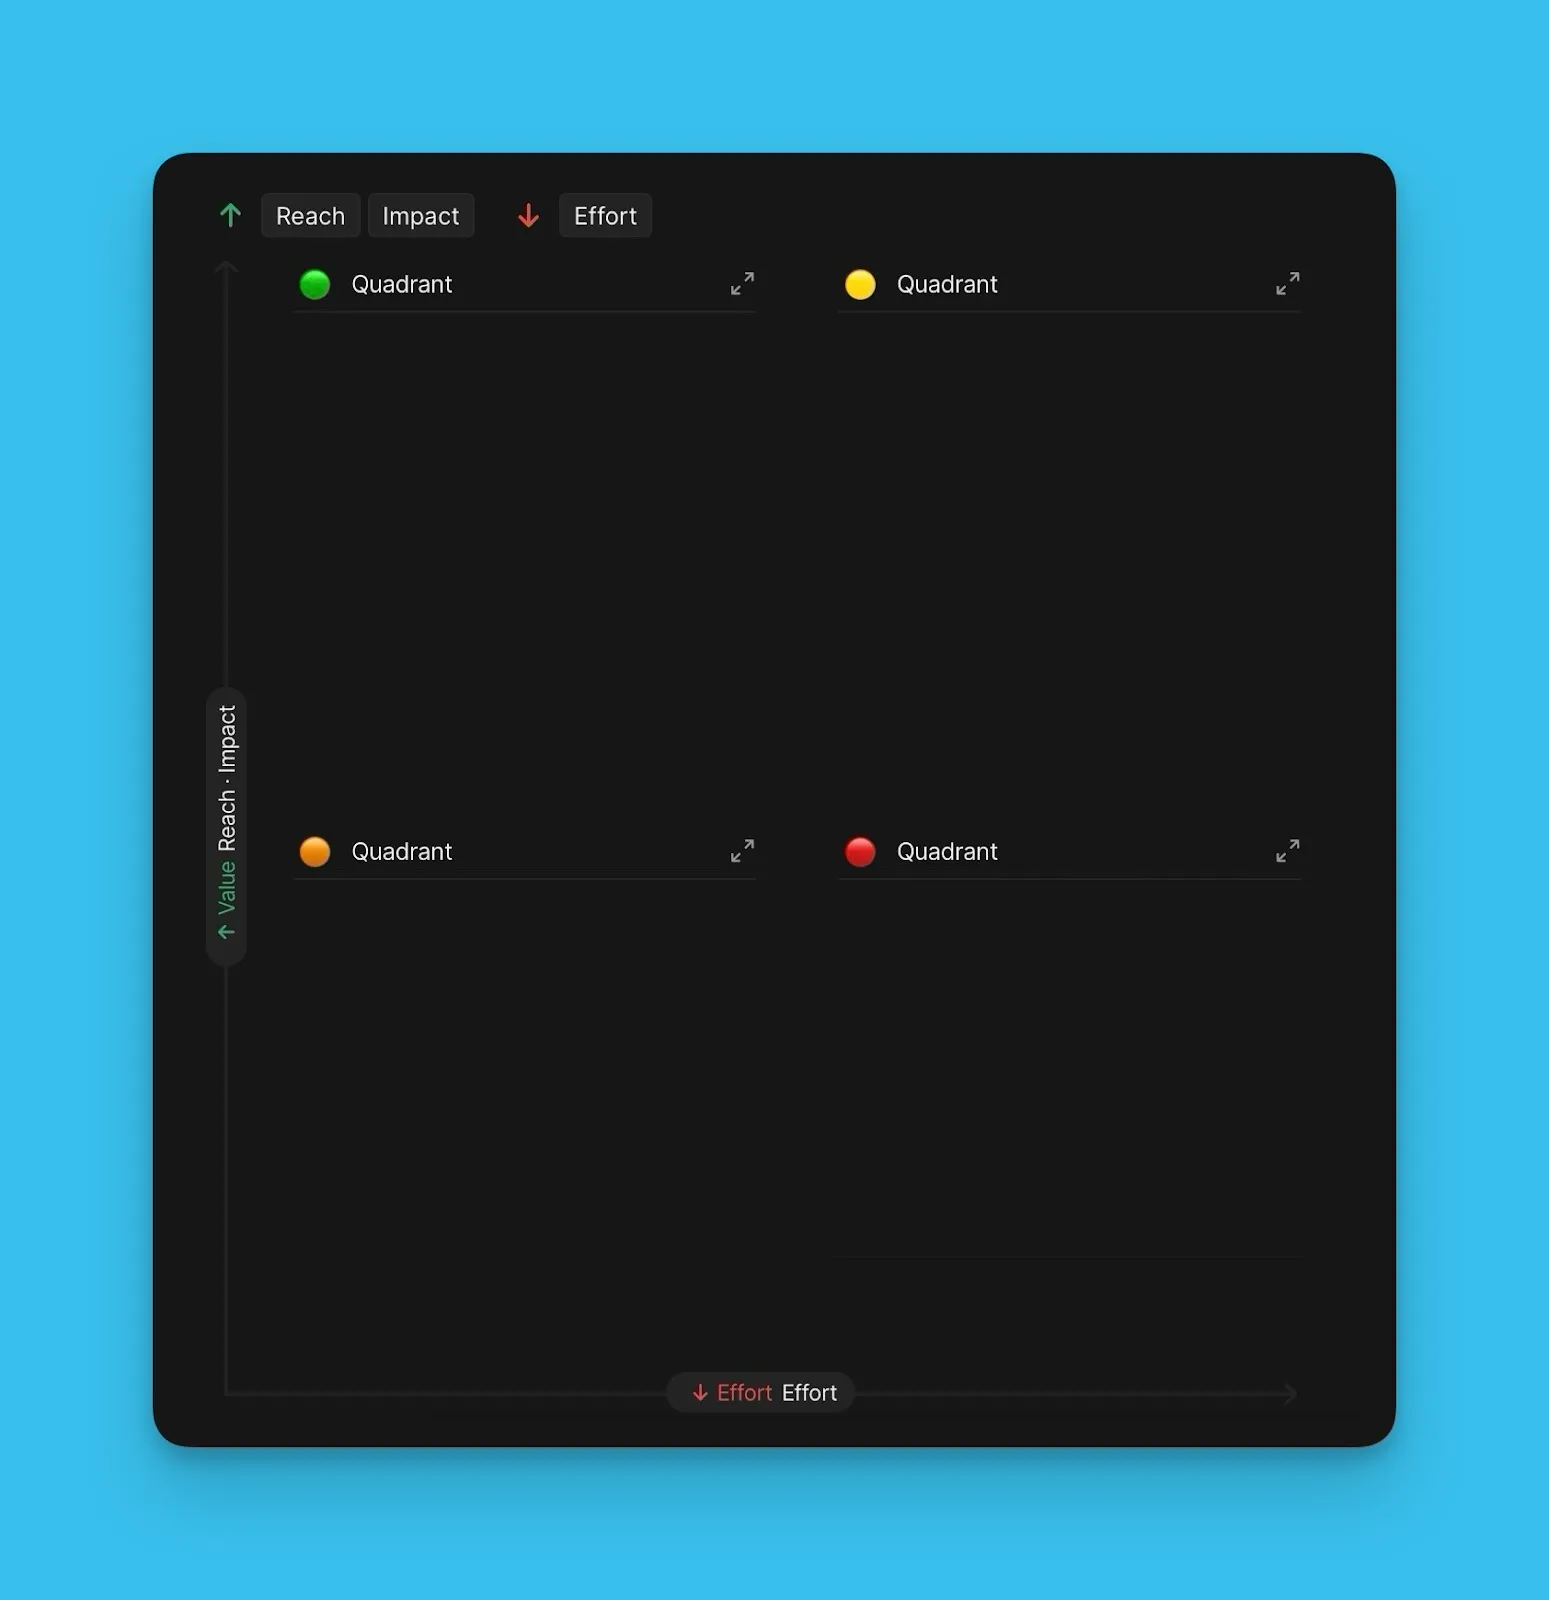
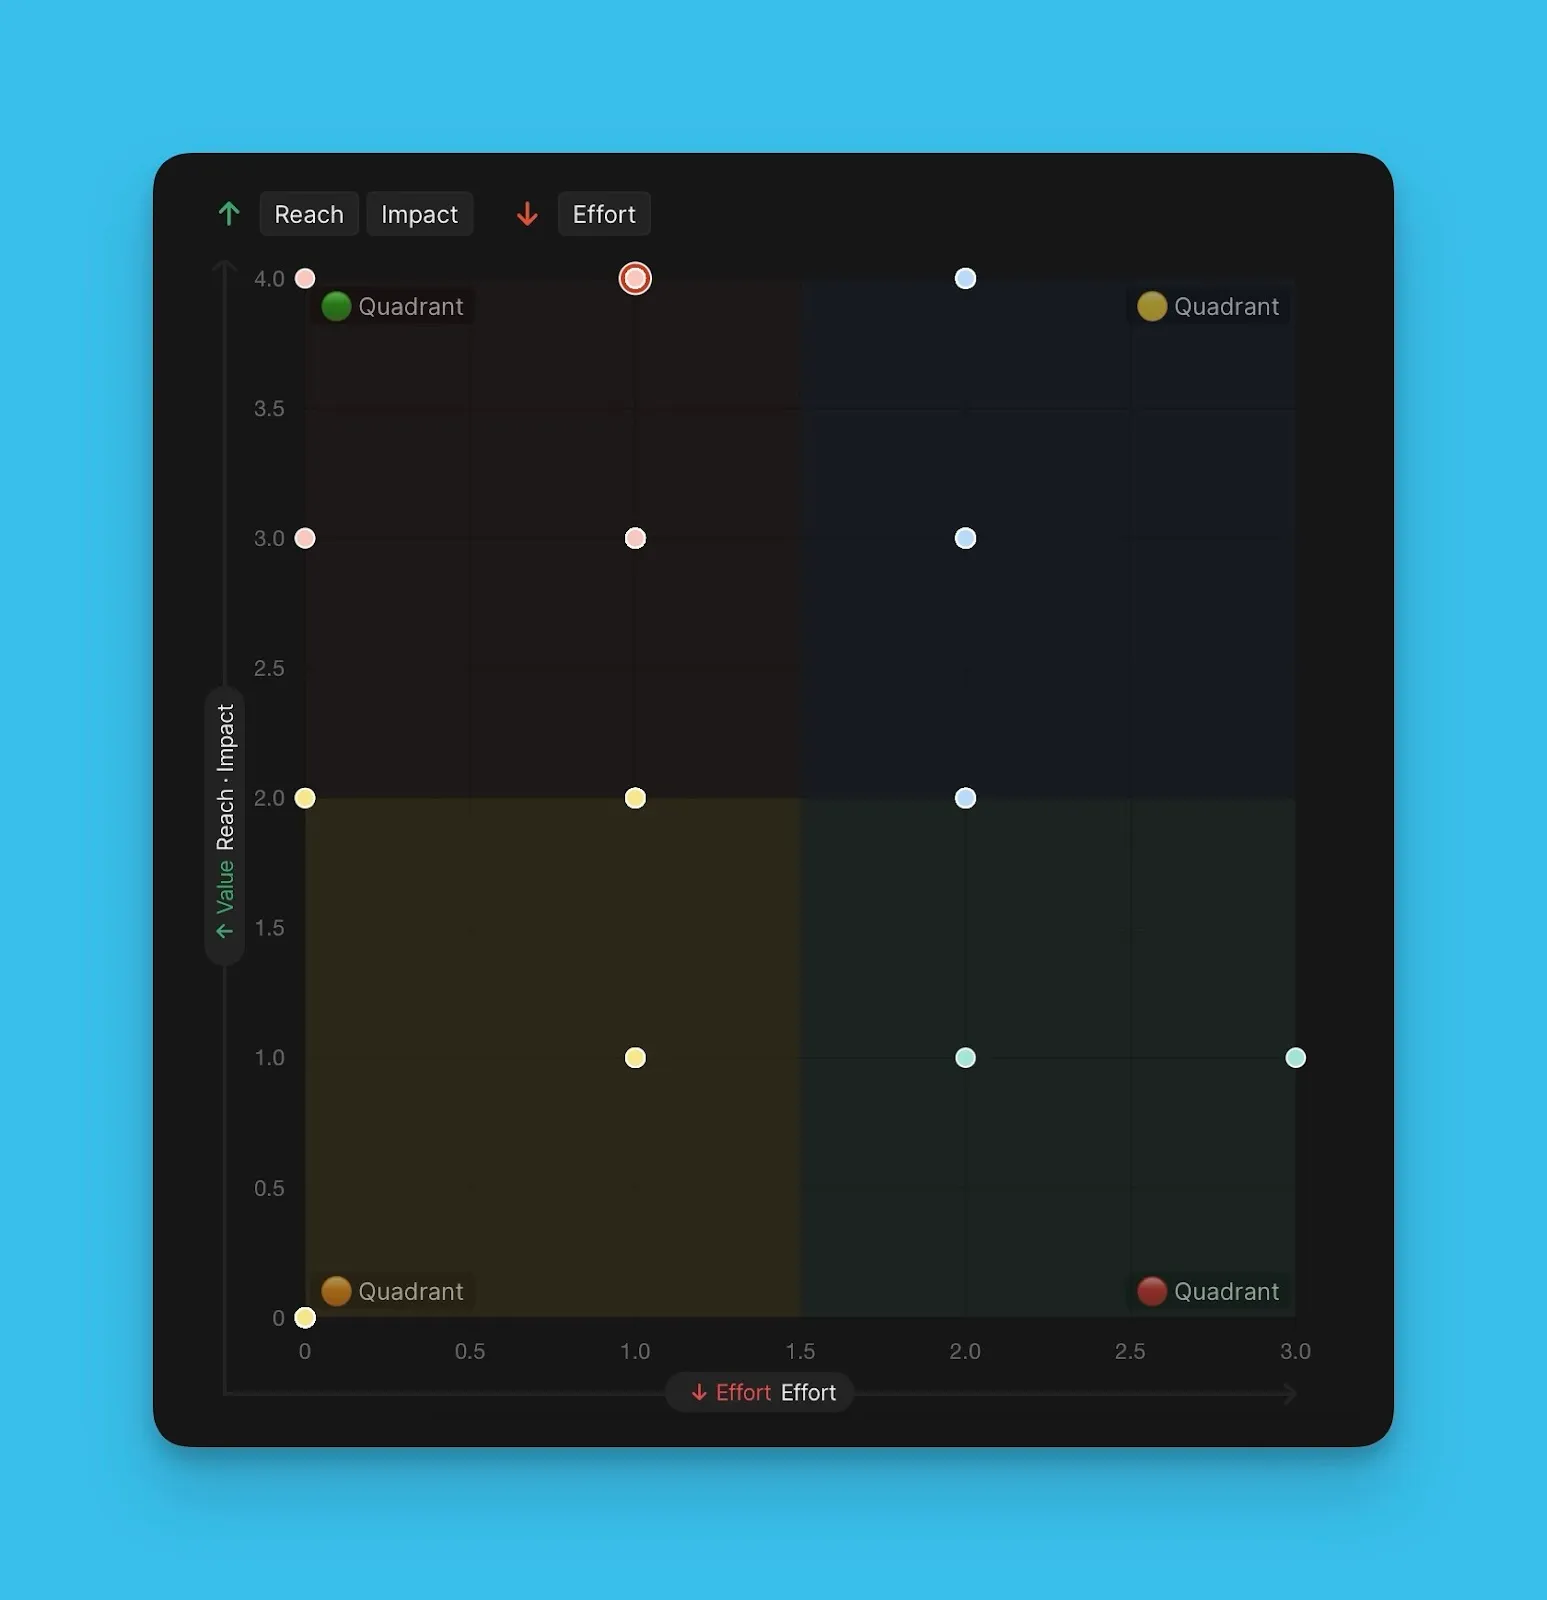
Página Matrix
A página Matrix apresenta uma grelha 2x2 que relaciona Valor com Esforço. Esta visualização ajuda-o a identificar os Itens de maior prioridade usando a abordagem da Matriz de Eisenhower.
O Valor (eixo y) é relacionado com o Esforço (eixo x). A grelha está dividida em quatro quadrantes:
-
Quadrante 1 (Do it First / Fazer Primeiro): Valor Elevado, Esforço Baixo—prioridade máxima
-
Quadrante 2 (Cut into Pieces / Dividir): Valor Elevado, Esforço Elevado
-
Quadrante 3 (Fill-ins / Preenchimentos): Valor Baixo, Esforço Baixo
-
Quadrante 4 (Too big to be true / Demasiado Grande): Valor Baixo, Esforço Elevado—prioridade mínima
Visualizações da Matrix
A página Matrix oferece duas opções de visualização:
List view (Vista de lista): Mostra os Itens em cada quadrante como uma lista ordenada, com o Item de maior prioridade no topo.
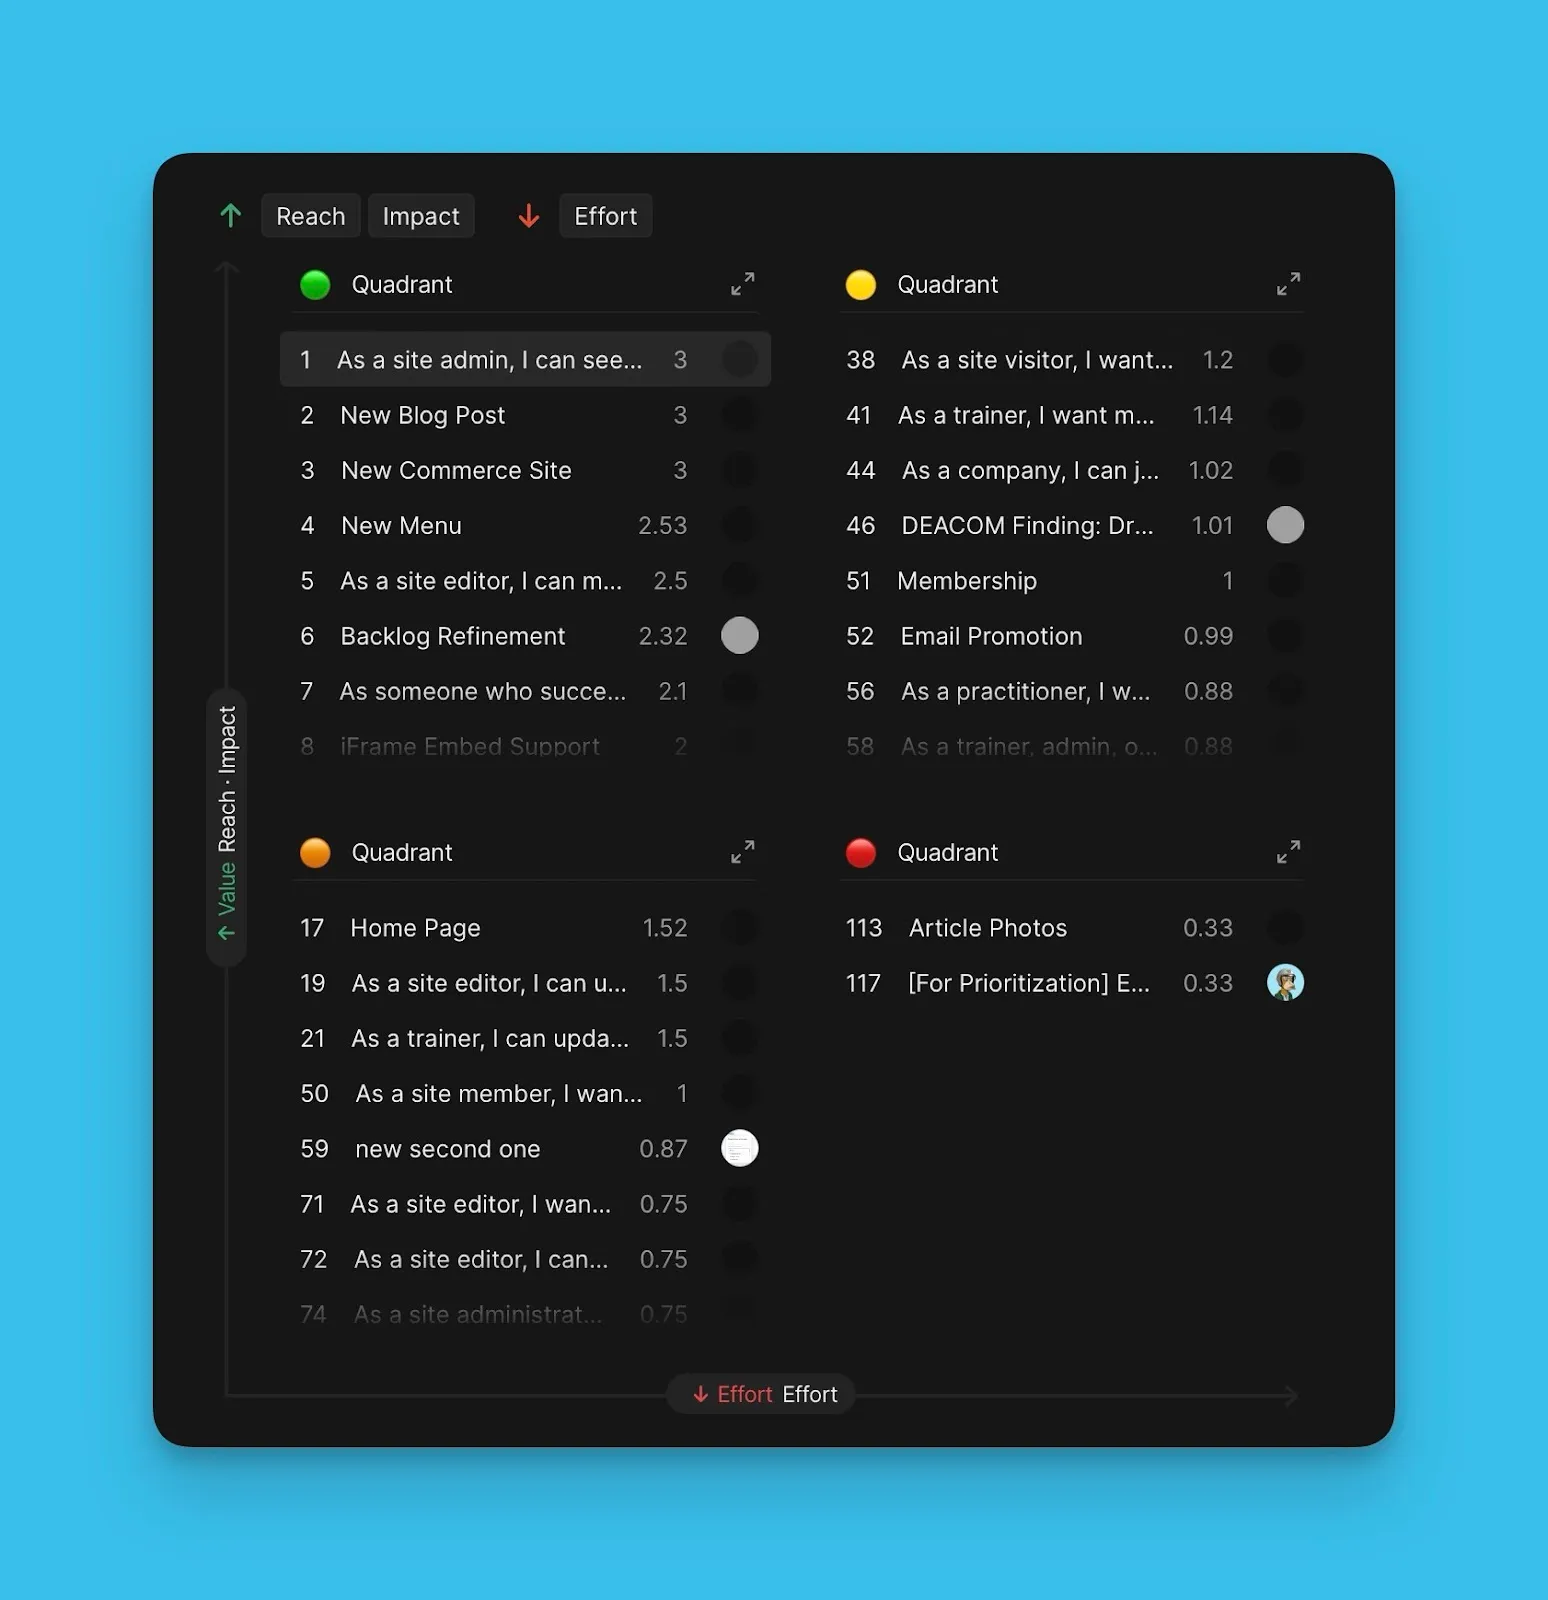
Chart view (Vista de gráfico): Apresenta os Itens como bolhas codificadas por cores posicionadas na grelha da matriz, mostrando exatamente onde cada Item se encontra.
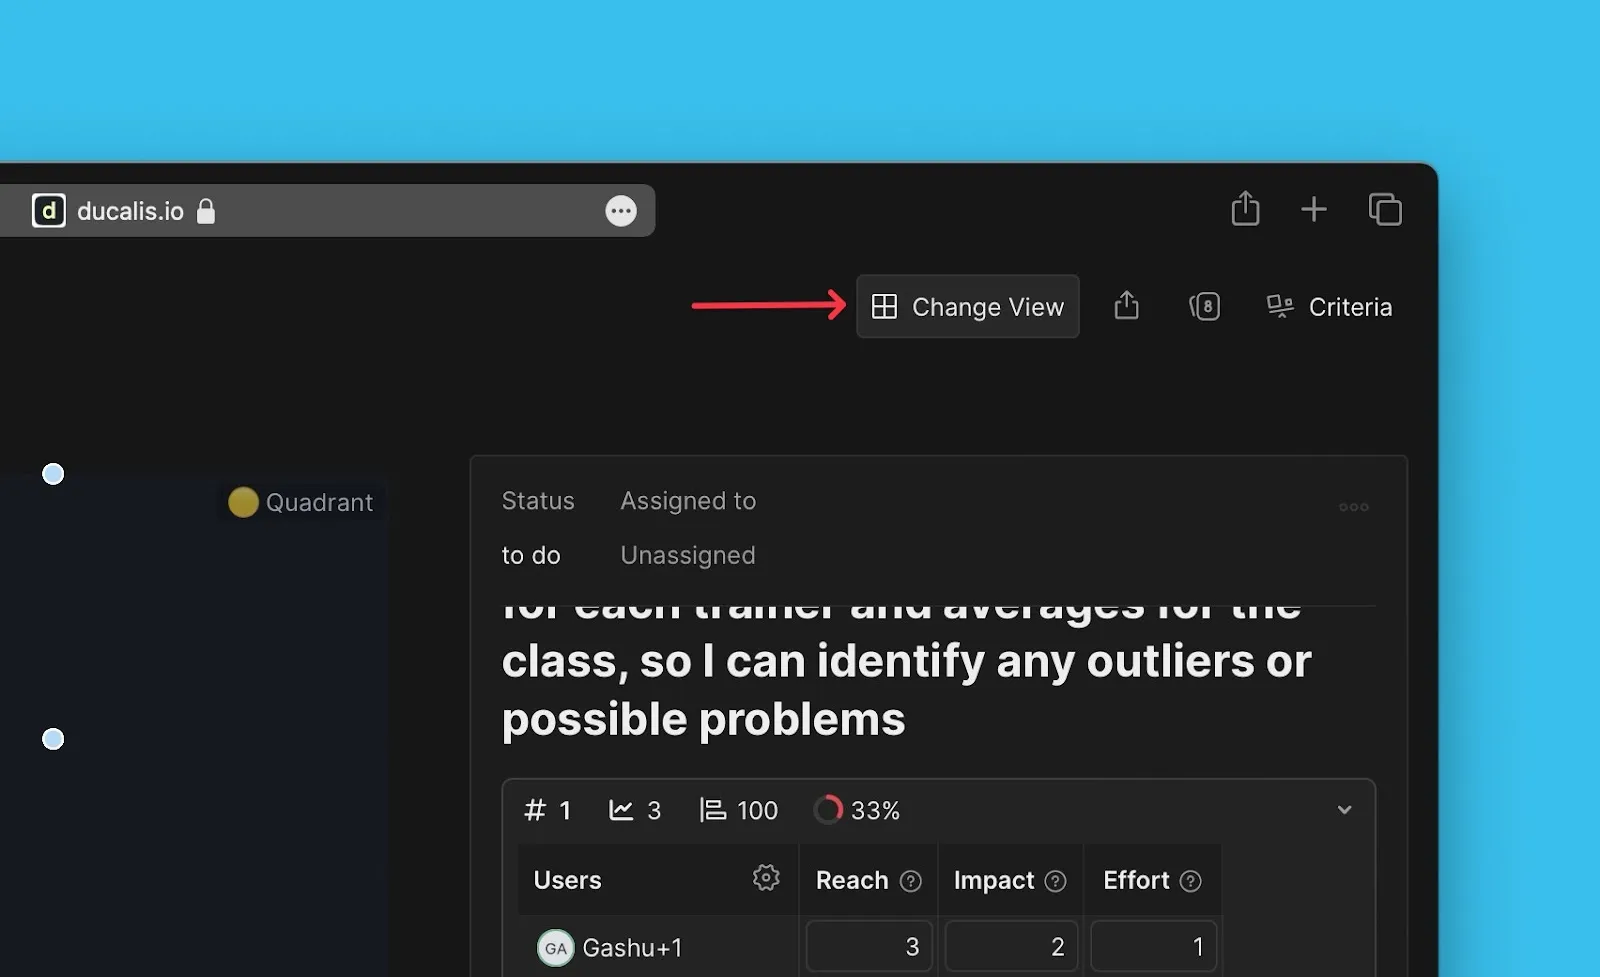
Alternar entre visualizações
Clique em Change View (Alterar Vista) para alternar entre a vista de lista e a vista de gráfico.
What's next
Sincronizar os resultados da priorização com um gestor de tarefas