ICE Framework
ICE Önceliklendirme Framework'ü, fikirleri Etki, Güven ve uygulama Kolaylığı temelinde değerlendirip sıralamanıza yardımcı olur. Bu basit puanlama sistemi, hızlı kazanımları belirler ve sınırlı kaynaklarla ROI'yi maksimize eder.
ICE önceliklendirme nedir
ICE, Impact (Etki), Confidence (Güven) ve Ease (Kolaylık) anlamına gelir. Takımlar bu framework'ü, sınırlı kaynaklarla hızlı büyüme ararken projeleri, özellikleri ve pazarlama girişimlerini değerlendirmek için kullanır.
Ücretsiz Ducalis ICE şablonu ile başlayın. Tamamen özelleştirilebilir.
ICE kriterleri
Etki (Impact)
Etki, bir özelliğin veya girişimin hedefinizi ne kadar ileriye taşıyacağını ölçer. Takımınız için "etki"nin ne anlama geldiğini tanımlayın ve bunu tüm öğelere tutarlı bir şekilde uygulayın. A Öğesini aktivasyon etkisi, B Öğesini ise retention etkisi açısından değerlendirmeyin—bu çabaları dağıtır ve sonuçları geciktirir.
Soruyu yanıtlar: Bu çözüm hedefimize ne kadar etkilidir?
Ölçek: 1'den 10'a kadar sayılar (orijinal). Fibonacci öneririz: 1, 2, 3, 5, 8, 13.
Güven (Confidence)
Güven, Etki ve Kolaylık tahminlerinizi doğrular veya sorgular. Bu kriter, önceliklendirmede duygusal önyargıyı engeller. Yüksek Güven puanları, tahminlerinizi destekleyecek veriniz olduğu anlamına gelir. Düşük puanlar, tahmine dayalı olduğunuzu gösterir.
Soruyu yanıtlar: Etki ve Kolaylık puanlarıma ne kadar eminim? Bunun beklendiği gibi işleyeceğinden ne kadar eminim?
Ölçek: 1'den 10'a kadar sayılar (orijinal). Fibonacci öneririz: 1, 2, 3, 5, 8, 13.
Kolaylık (Ease)
Kolaylık, çözümü ne kadar hızlı ve ucuz uygulayabileceğinizi ölçer. Efor veya karmaşıklığa odaklanan framework'lerin aksine (negatif faktörler), ICE perspektifi tersine çevirir—daha kolay görevler daha yüksek puan alır.
Soruyu yanıtlar: Bu çözümü geliştirmek ve yayınlamak ne kadar kolaydır? Ne kadar hızlı sonuç alabiliriz?
Ölçek: 1'den 10'a kadar sayılar (orijinal). Fibonacci öneririz: 1, 2, 3, 5, 8, 13.
ICE puanı nasıl hesaplanır
- Etki + Güven + Kolaylık puanlarını toplayın.
- Toplamı 3'e bölün.

Dezavantajlar ve çözümler
ICE sıklıkla öznellik nedeniyle eleştirilir—puanlar manipüle edilebilir ve farklı insanlar öğeleri farklı puanlar.
Öznelliğe yanıt: Birisi sonuçları çarpıtmak isterse herhangi bir framework manipüle edilebilir. Asıl soru şudur: Sonucu zaten belirlediyseniz neden önceliklendiriyorsunuz? ICE, takımlar dürüst önceliklendirme yaptığında işe yarar.
Puanlama varyasyonuna yanıt: Farklı insanların farklı tahmin etmesi, puanlarını topladığınızda bir güce dönüşür. Birçok çalışma, bir grubun tahminlerinin ortalamasının şaşırtıcı derecede doğru sonuçlar ürettiğini göstermektedir. Ducalis gibi araçlarla bu otomatiktir—takım üyeleri bağımsız olarak puanlar ve sistem ortalamayı hesaplar. Toplantı gerekmez.
Gerçek dezavantaj: 1-10 ölçeği çok kesindir. Bir şeyin 6 mı 7 mi puan alacağına karar vermek zaman kaybıdır ve tutarsız sıralamalar üretir. Bu yüzden varsayılanı Fibonacci (1, 2, 3, 5, 8, 13) olarak değiştirdik. 5 ile 8 arasında karar vermek çok daha kolaydır.
Basitlik ödünü: ICE son derece basittir. Bu, önceliklendirmeye hemen başlamanızı ve hızlı kazanımları hızla belirlemenizi sağlar. Erken aşama hızlı büyüme için mükemmeldir. Ancak birçok değişkenli karmaşık ürünler için ICE aşırı basitleştirilmiştir. ICE ile başlamaktan çekinmeyin—sadece zamanla benzersiz önceliklerinizi yansıtan kriterler ekleyerek özelleştirin.
ICE kimin için
En uygun:
- Ürün özellikleri, kullanıcı hikayeleri veya büyüme deneyleri önceliklendiren takımlar
- Sınırlı kaynaklarla hızlı büyümeye ihtiyaç duyan startup'lar ve takımlar
- Hızın derinlikli analizden daha önemli olduğu projeler
Avantaj ve Dezavantajlar
Avantajlar:
- Hızlı önceliklendirme: Az kriter, göreceli sayılar, aynı ölçekler
- Sınırlı kaynaklarla ROI'ye odaklanır
- Öğrenmesi ve uygulaması kolaydır
Dezavantajlar:
- Öznel puanlama (takım puanlarının ortalaması ile azaltılır)
- Birçok değişkenli karmaşık ürünler için aşırı basitleştirilmiştir
ICE şablon kurulumu
Ducalis ICE şablonu tamamen özelleştirilebilir.
Kriter 1: Etki
- İsim: Impact
- Tür: Value
- Ağırlık: 1
- Puanlar: 0, 1, 2, 3, 5, 8
- Açıklama: Özellik hedefleri ne kadar olumlu etkileyecek? Bu özellik stratejik bir hedefe ulaşmamıza yardımcı olur mu?
Kriter 2: Güven
- İsim: Confidence
- Tür: Value
- Ağırlık: 1
- Puanlar: 0, 1, 2, 3, 5, 8
- Açıklama: Etki ve Efor puanlarını kanıtlamak için ne kadar verimiz var? Tahminlerime ne kadar eminim?
Kriter 3: Efor
- İsim: Effort
- Tür: Effort
- Ağırlık: -1
- Puanlar: 0, 1, 2, 3, 5, 8
- Açıklama: Bu özelliği geliştirmek, test etmek ve yayınlamak ne kadar zordur? Sonuçları almak ne kadar sürecek?
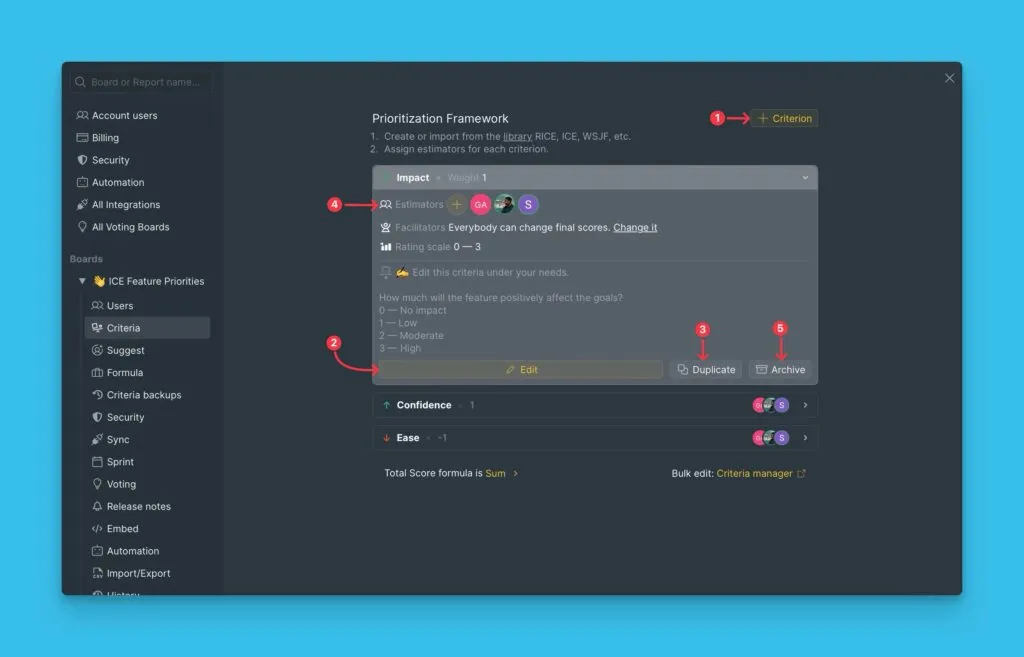
Yeni kriterler ekleyebilir, ayarları düzenleyebilir, değerlendirmek için belirli kişiler atayabilir, çoğaltabilir, arşivleyebilir veya kriterleri silebilirsiniz.
Daha fazla bilgi: Değerlendirme kriterlerini ekleyin, düzenleyin veya silin
Değerlendirme sonuçları görünümleri
Değerlendirme sonuçları iki görünümde mevcuttur: Backlog ve Matrix. Öncelikleri farklı hesaplar ve farklı karar verme ihtiyaçlarına hizmet ederler. Herhangi bir Pano'nun üstündeki sekmeler aracılığıyla görünümler arasında geçiş yapın.
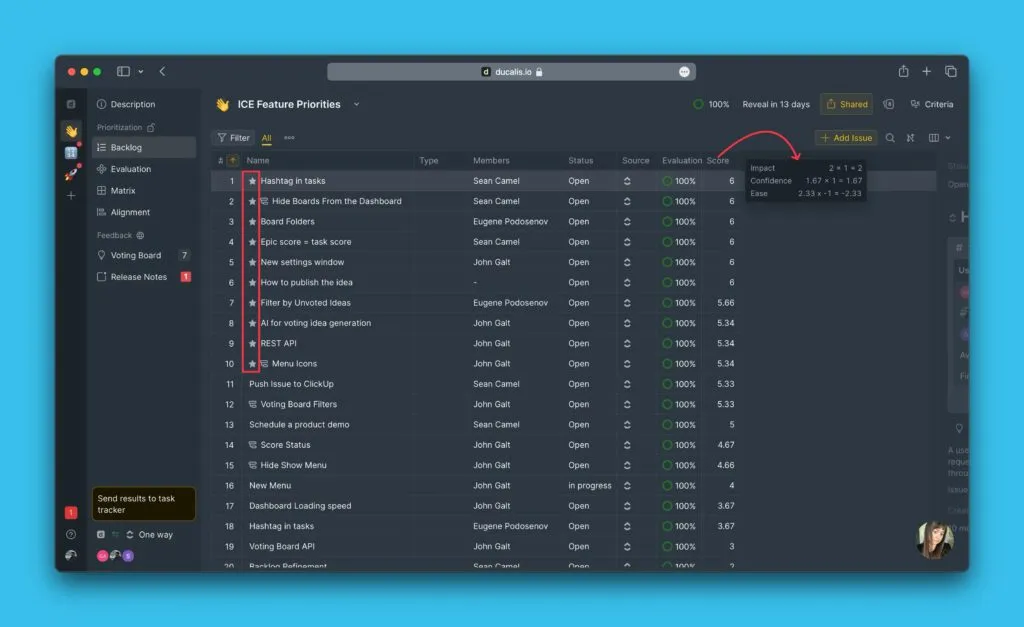
Backlog
Backlog ağırlıklı puanları hesaplar ve öğeleri sıralı bir listede görüntüler. Ağırlık ayarı, her kriterin etkisini (pozitif veya negatif) belirler. Tüm puanlar ağırlıklarıyla çarpılır.
Backlog'da ICE formülü:
(Impact Puanı × 1) + (Confidence Puanı × 1) + (Effort Puanı × -1) = ICE Toplam Puanı
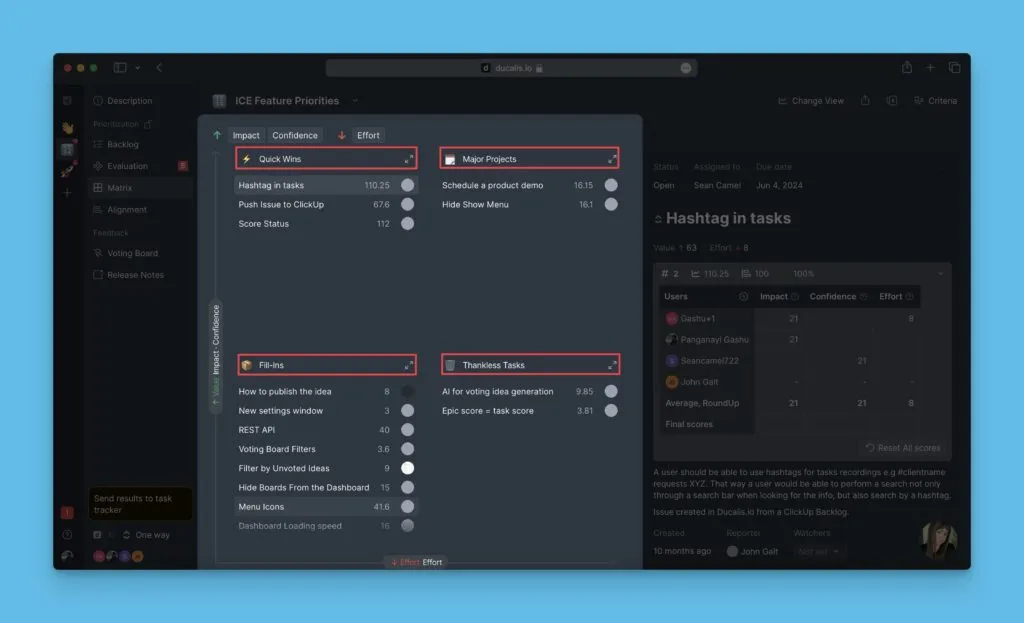
Matrix
Matrix ağırlıksız puanları hesaplar ve öğeleri 2×2 ızgarada görüntüler. Kriter türü (Value veya Effort) ekseni belirler. Puanlar ağırlıklarla çarpılmaz.
Matrix sayfasında Impact, Confidence ve Effort filtre olarak çalışır. Öğelerin kadranlar arasındaki dağılımını değiştirmek için kriterleri açıp kapatın: Quick Wins, Major Projects, Fill-Ins, Thankless Tasks. Kadranları yeniden adlandırabilirsiniz.
Pazarlama önceliklendirmesi için ICE
Pazarlama takımları ICE'yi kampanyaları, girişimleri ve büyüme deneylerini etki ve efor temelinde değerlendirmek için kullanır.
Pazarlama kriterleri
Impact:
- Bu girişimden tanıtım hedefleri açısından potansiyel kazanç ne kadar büyüktür?
- Fibonacci ile tahmin edilir: 1, 2, 3, 5, 8, 13
- En iyi pazarlamacılar tarafından tahmin edilir
Confidence:
- Impact ve Ease puanlarını kanıtlamak için ne kadar verimiz var? Tahminlerime ne kadar eminim?
- Fibonacci ile tahmin edilir: 1, 2, 3, 5, 8, 13
- En iyi pazarlamacılar ve projeye katılan takım arkadaşları (tasarımcılar, yazarlar) tarafından tahmin edilir
Ease:
- Bu girişimi uygulamak ne kadar kolaydır? Ne kadar hızlı sonuç alabiliriz?
- Fibonacci ile tahmin edilir: 1, 2, 3, 5, 8, 13
- En iyi pazarlamacılar ve projeye katılan takım arkadaşları (tasarımcılar, yazarlar) tarafından tahmin edilir
ICE puanlarını görev takipçinizle senkronize edin
Ducalis'de doğrudan görev oluşturabilir veya bir elektronik tablo yükleyebilirsiniz.
Jira, Asana, Trello, ClickUp, YouTrack, Linear veya GitHub gibi görev takipçinizi de bağlayabilirsiniz.
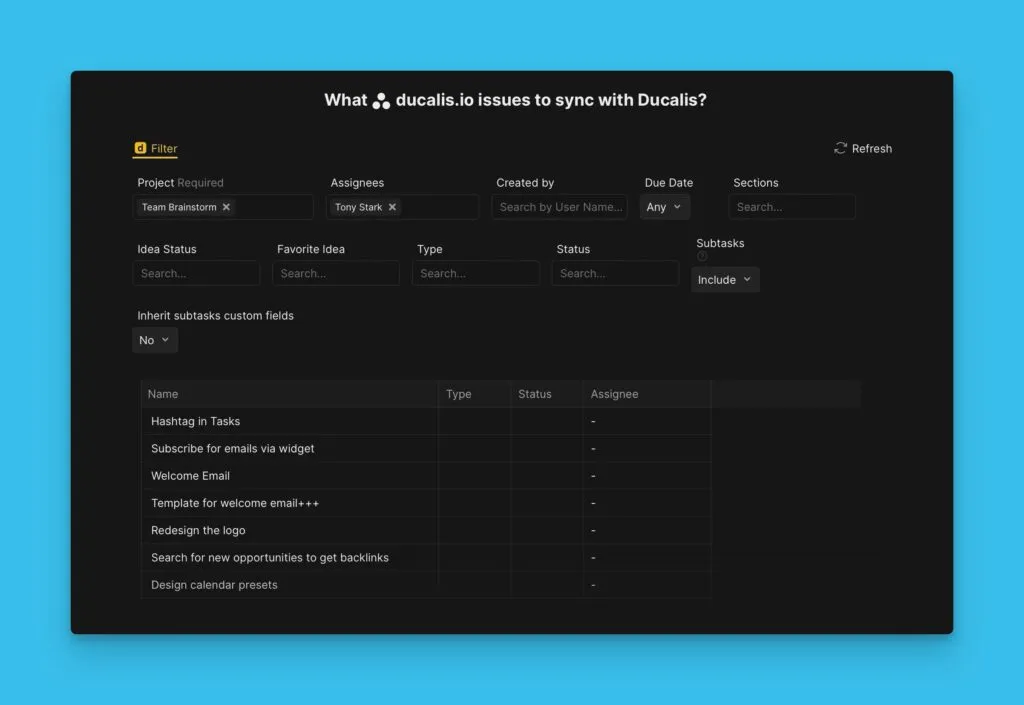
Görev takipçi → Ducalis senkronizasyonu
Otomatik senkronizasyon için görev takipçinizi bağlayın. Filtreyi bir kez ayarlayın, Ducalis'deki görevler her zaman backlog'unuzu yansıtacaktır.
Ducalis → Görev takipçi senkronizasyonu
Backlog'unuzu Ducalis'e bağlarsanız, öncelik puanlarını görev takipçinize geri senkronize edebilirsiniz. Ducalis'de görevleri değerlendirin, ardından backlog'u önceliğe göre sıralamak için sıralamaları görev takipçiye gönderin.