5. Adım. Sonuçları Görüntüleyin ve Analiz Edin
Önceliklendirme sonuçlarını görüntüleyip analiz ederek ekibinizin öncelikle hangi Kayıtlarla ilgilenmesi gerektiğini belirleyin. Sonuçlar İş Listesi sayfasında (sıralı liste) ve Matris sayfasında (görsel kadranlar) görünür.
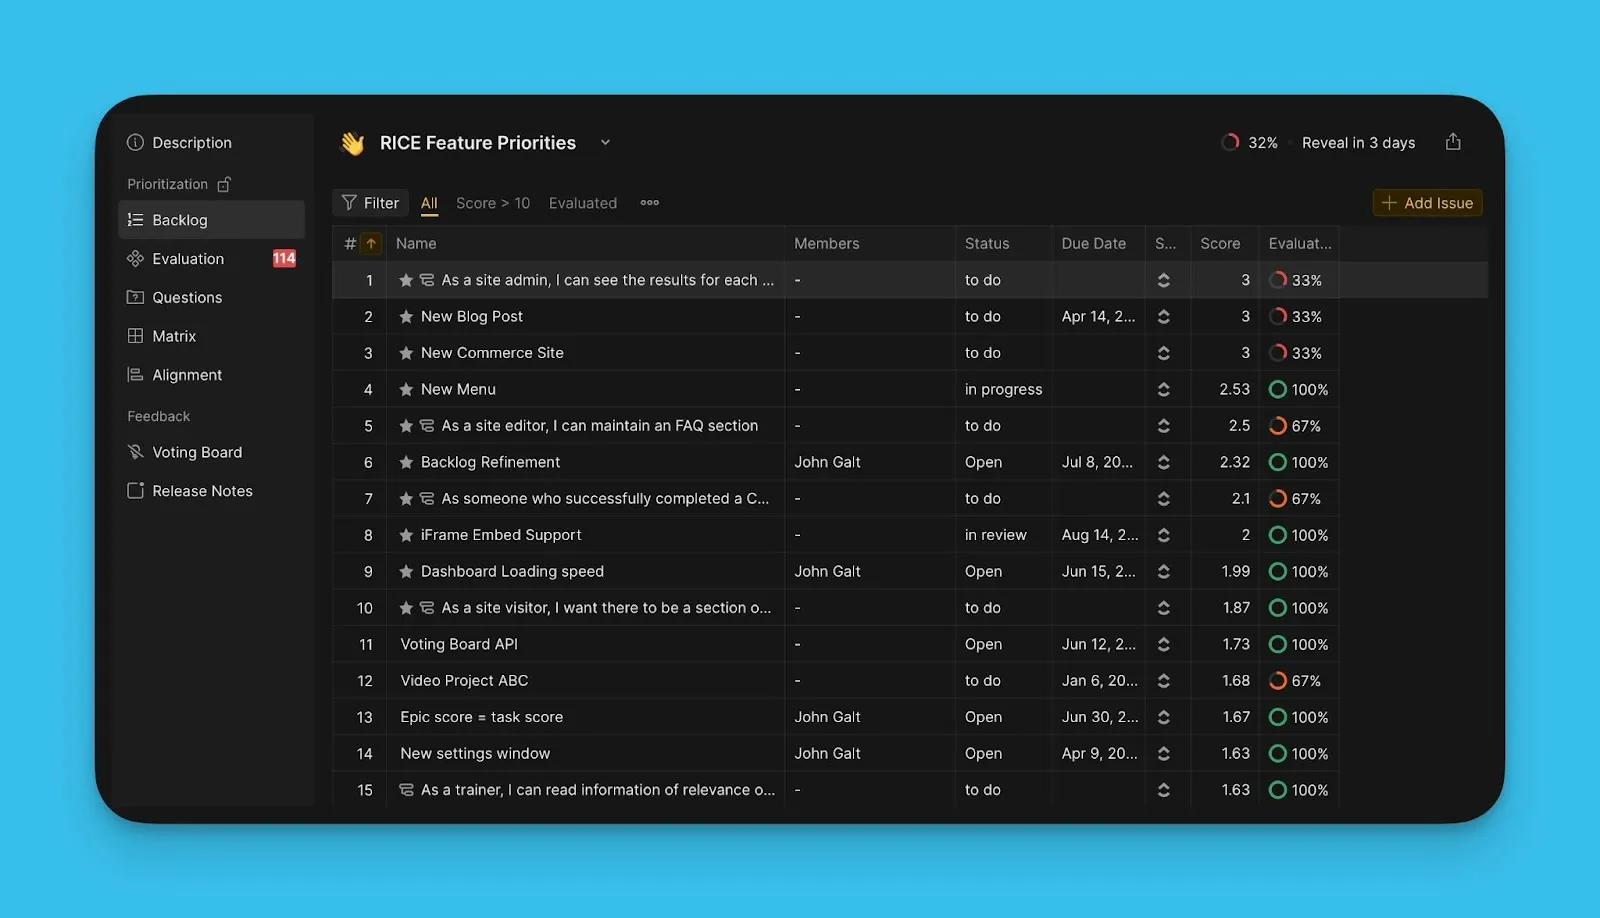
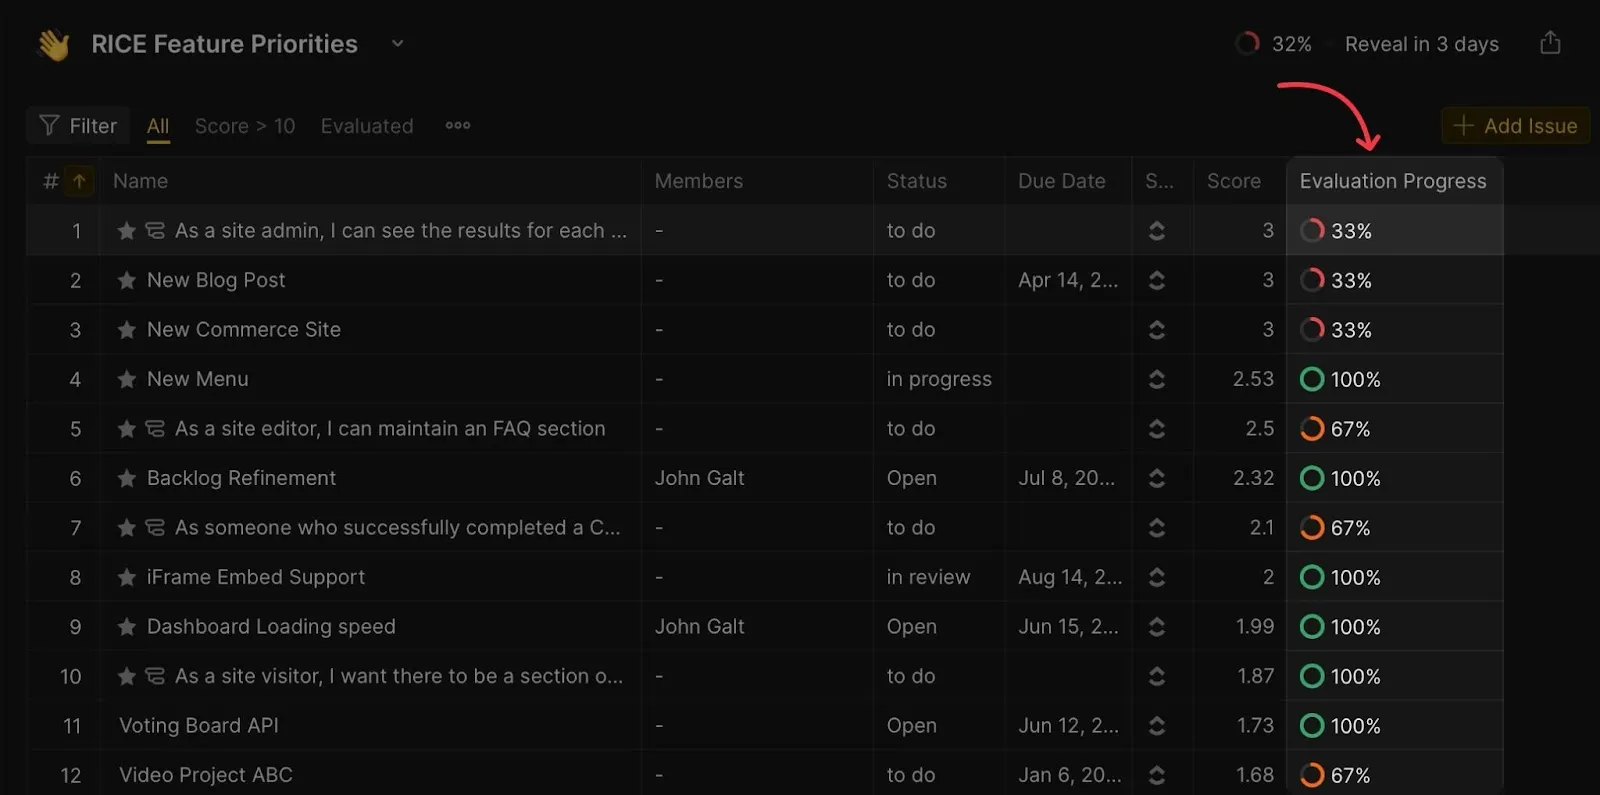
İş Listesi sayfası
İş Listesi sayfası öncelik puanına göre sıralanmış tüm Kayıtları gösterir. En yüksek öncelikli Kayıt en üstte görünür.
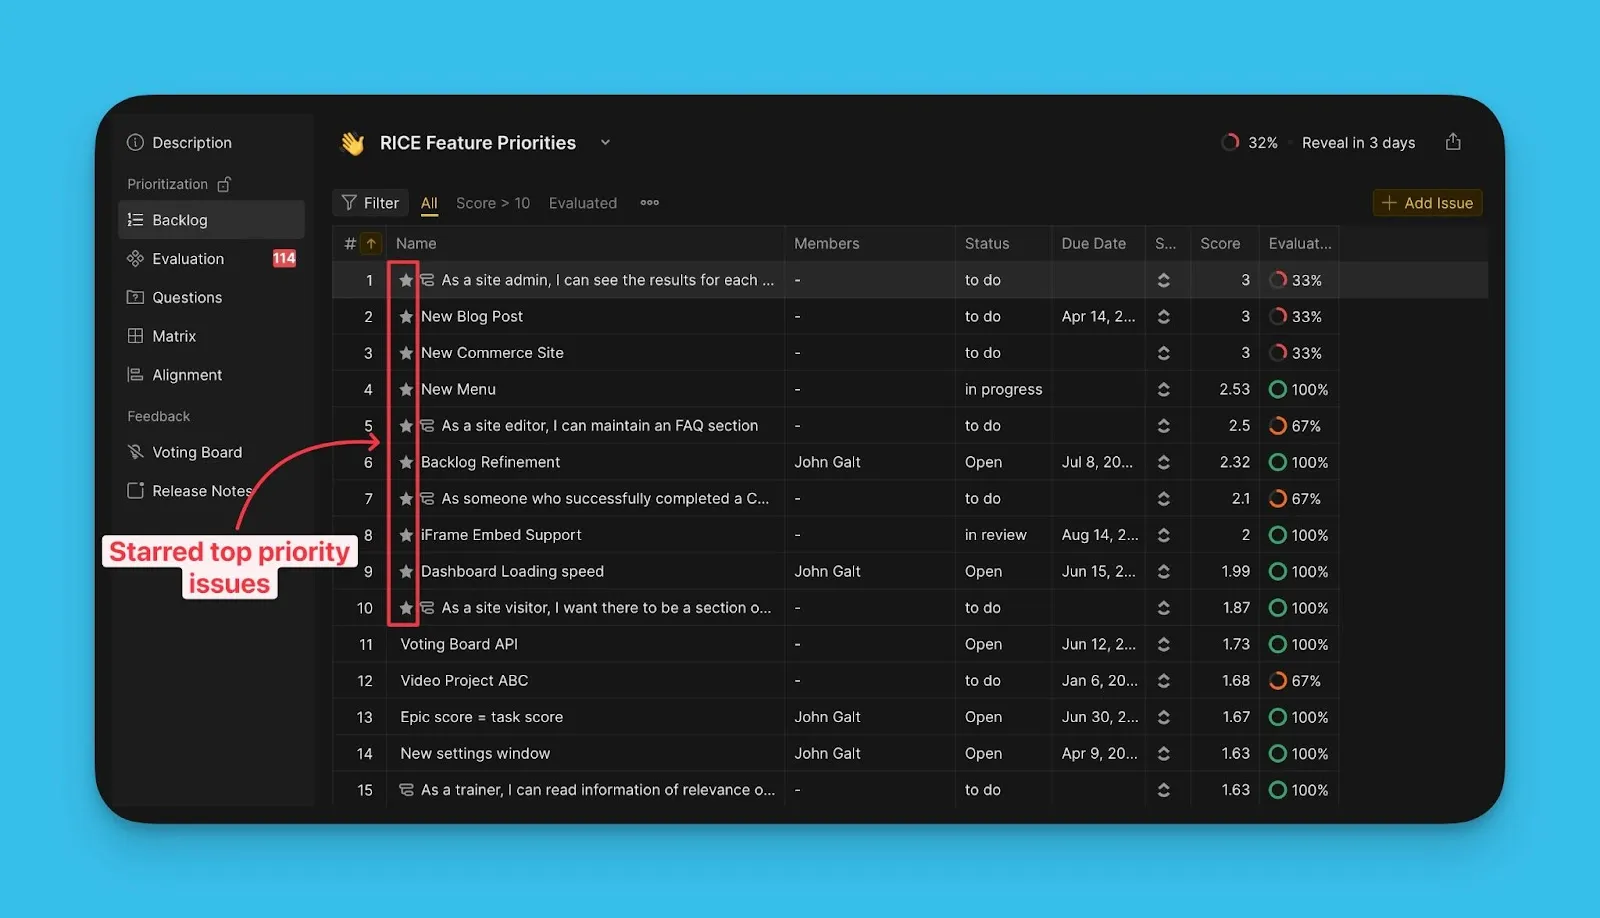
Öncelikli Kayıtlar yıldızlanır. Ekibinizin sprint kapasitesine göre öncelikli liste sayısının kaç Kayıttan oluşacağını belirleyebilirsiniz.
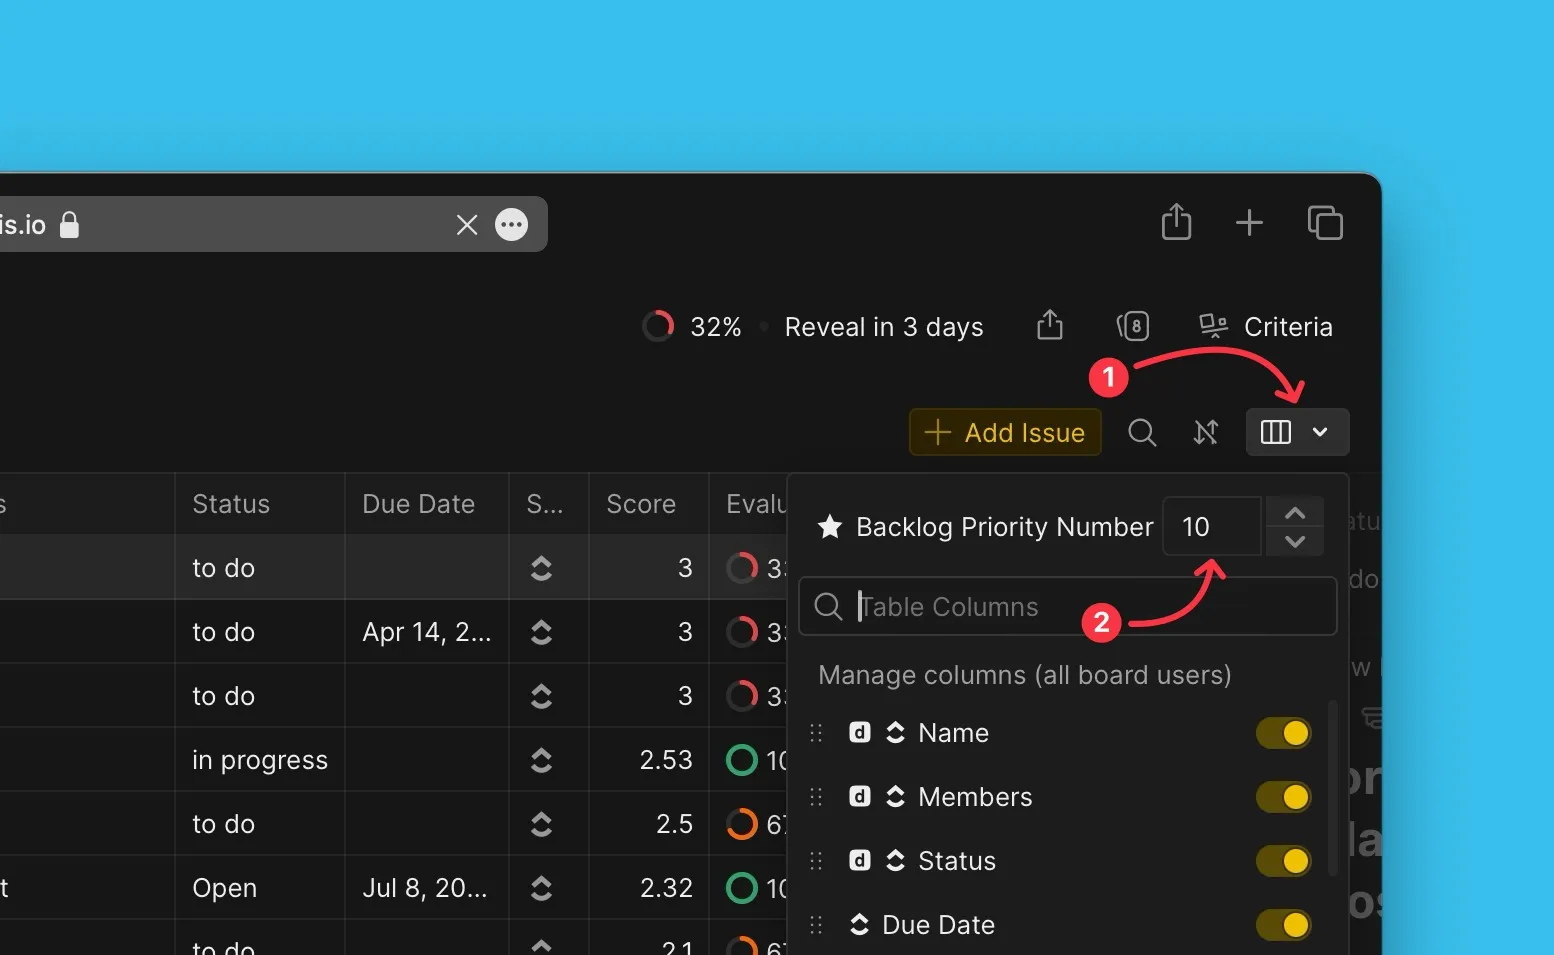
Öncelik sayısını ayarlama
-
Öncelikli listenizde görmek istediğiniz Kayıt sayısını girin.
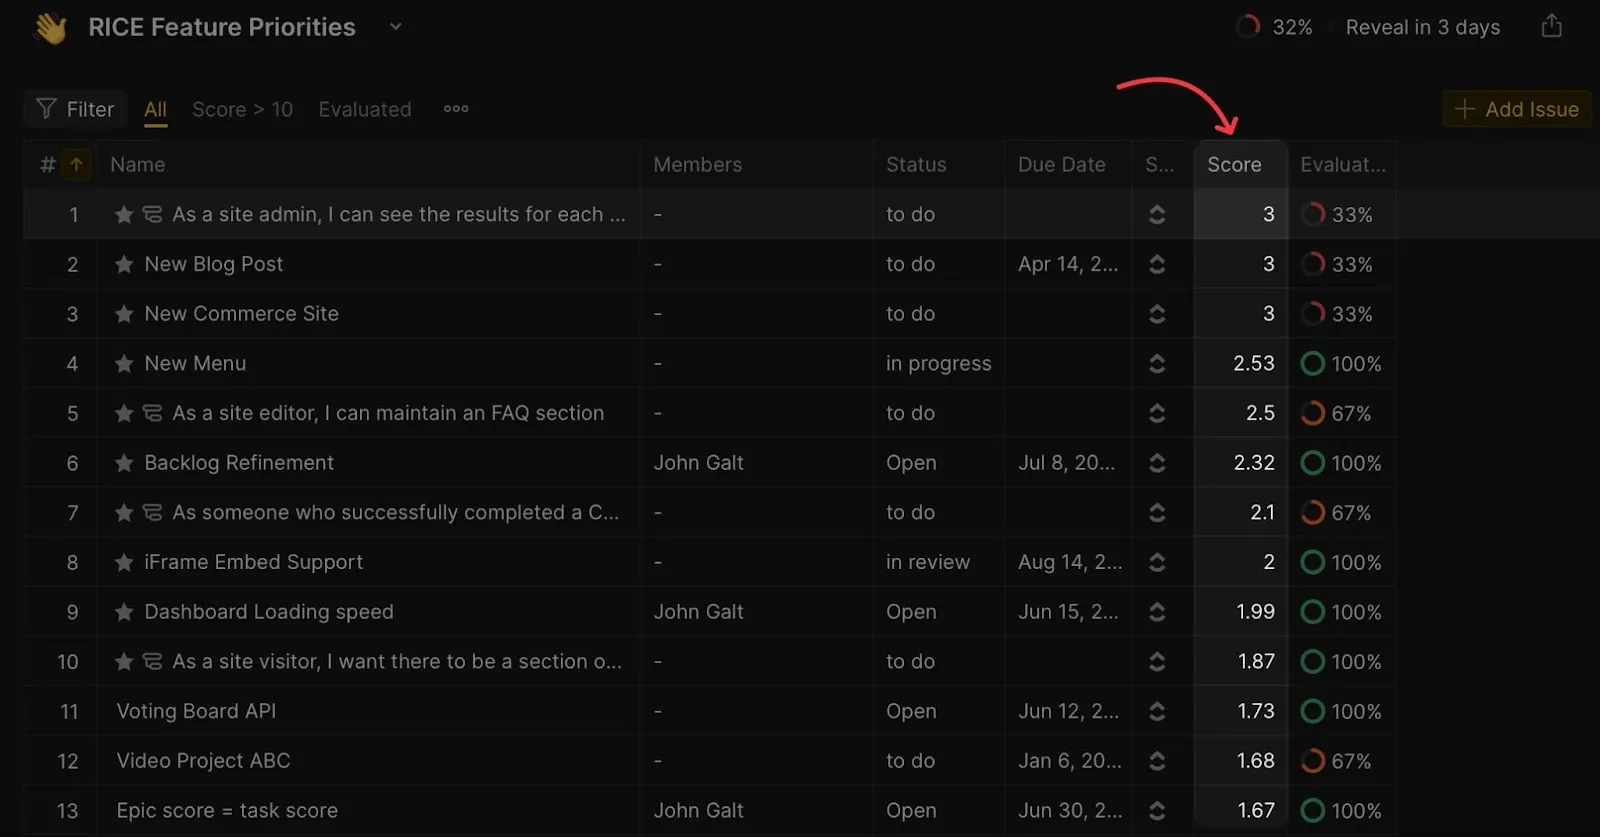
Puanları görüntüleme
Puanlar (Scores) sütunu her Kayıt için Nihai Puanı gösterir; en yüksek puan en üsttedir.
Değerlendirme ilerlemesini görüntüleme
Değerlendirme ilerleme sütunu her Kayıt için değerlendirme yapan Değerlendiricilerin yüzdesini gösterir.
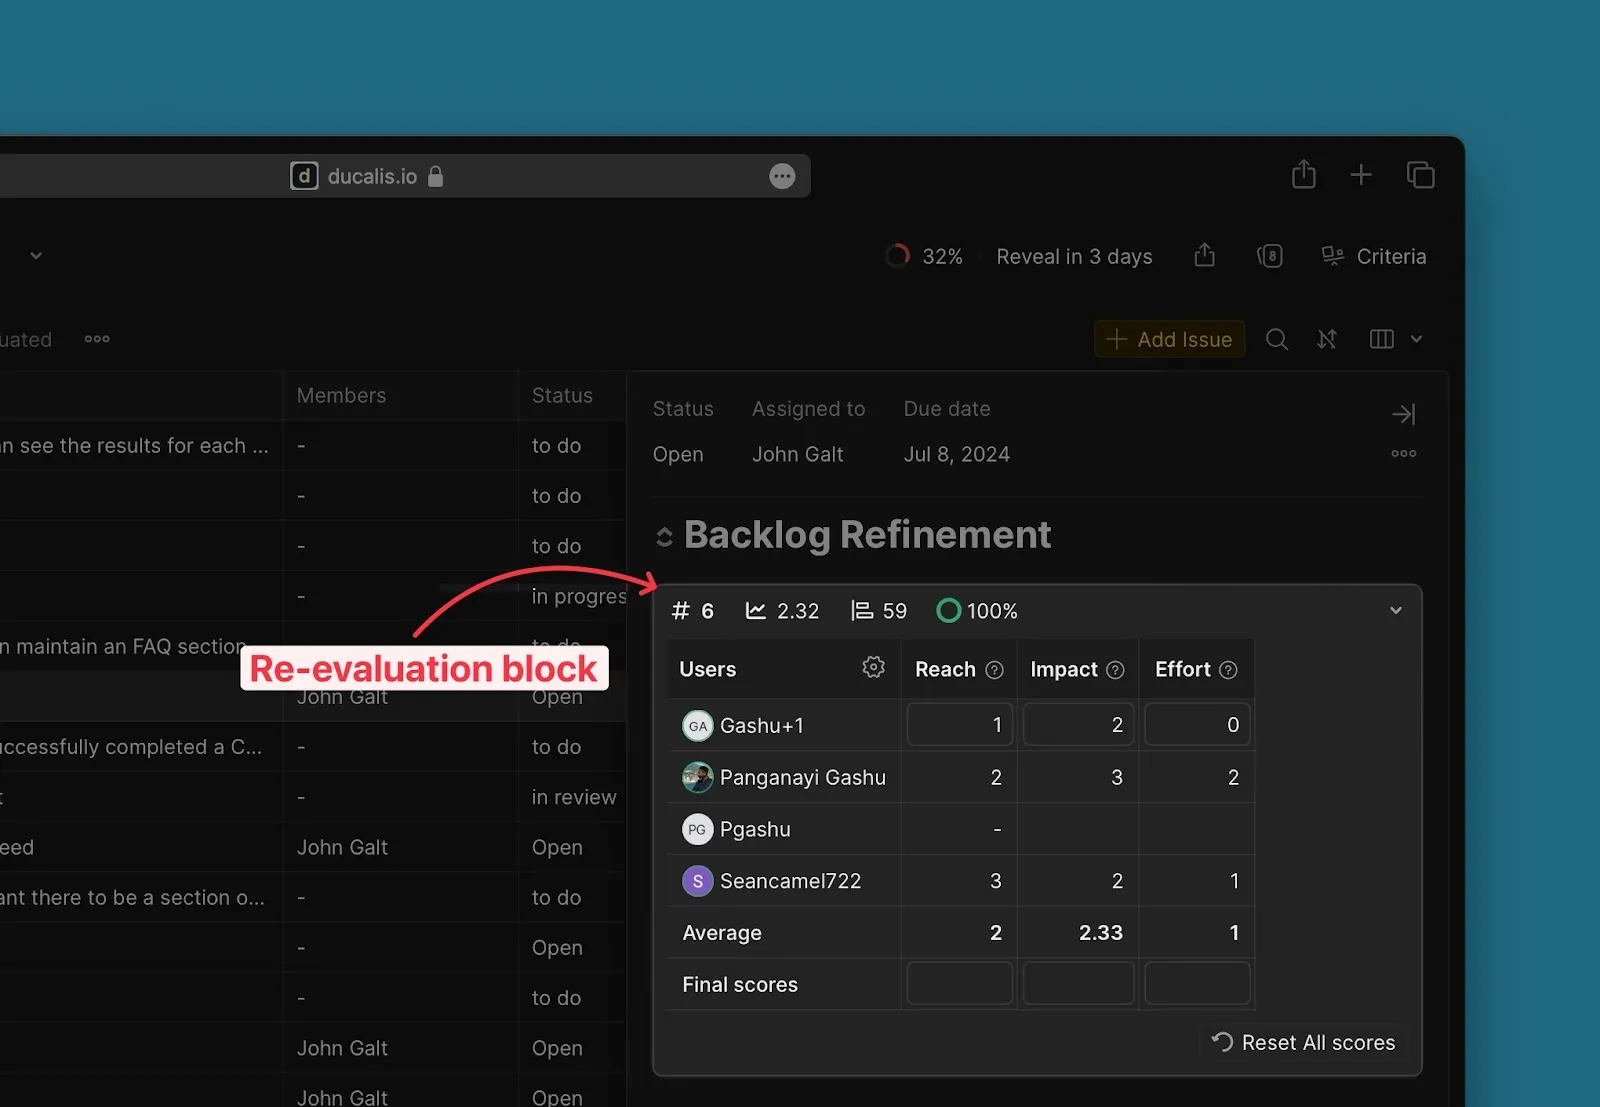
Kriterlere göre detaylı puanları görüntüleme
Herhangi bir Kayıt kartını genişleterek yeniden değerlendirme bloğunu görün. Bu blok, her Kriter için sizin puanlarınızı ve ekip arkadaşlarınızın puanlarını gösterir.
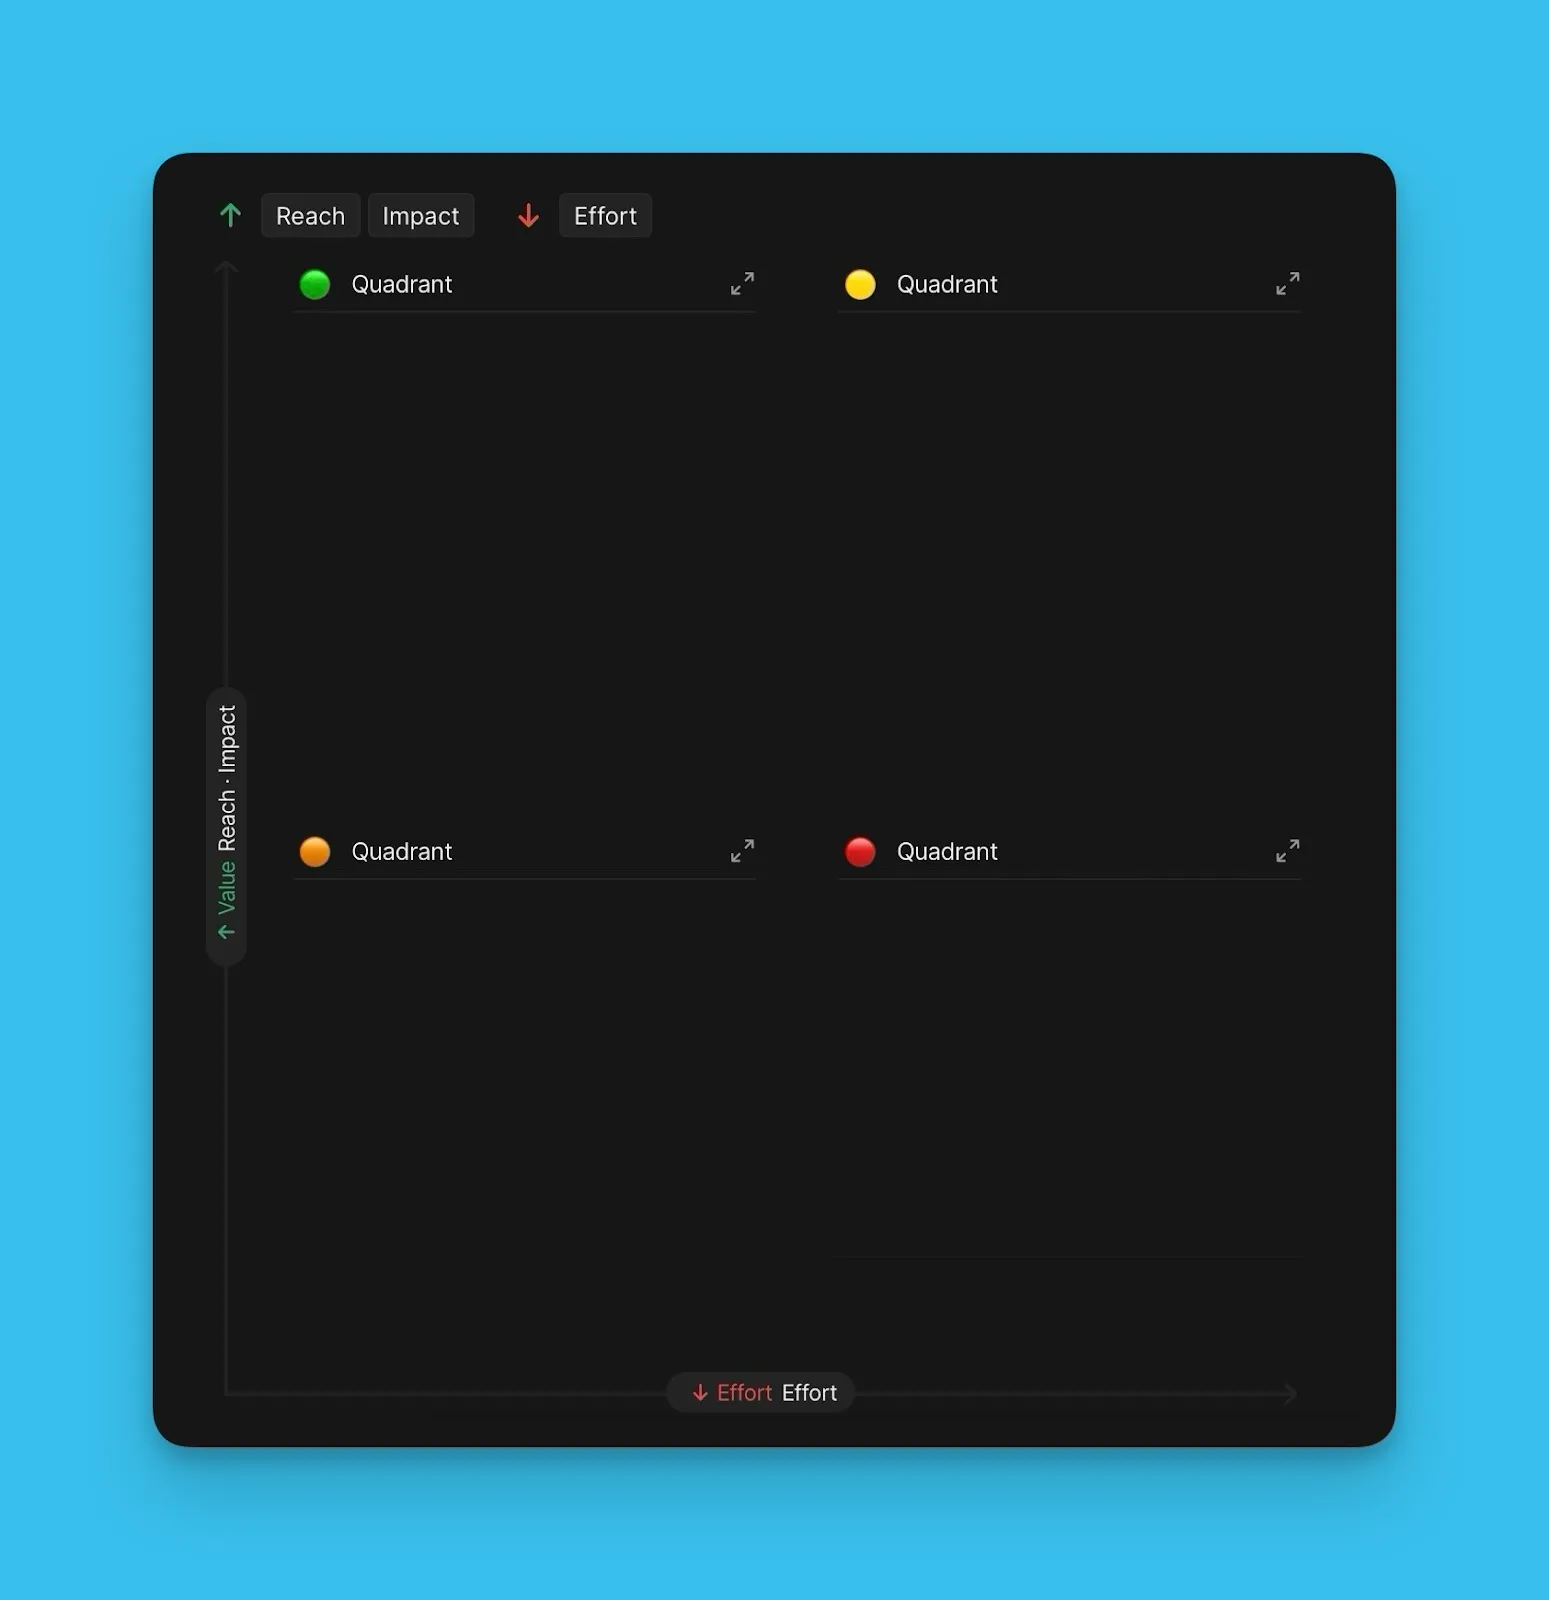
Matris sayfası
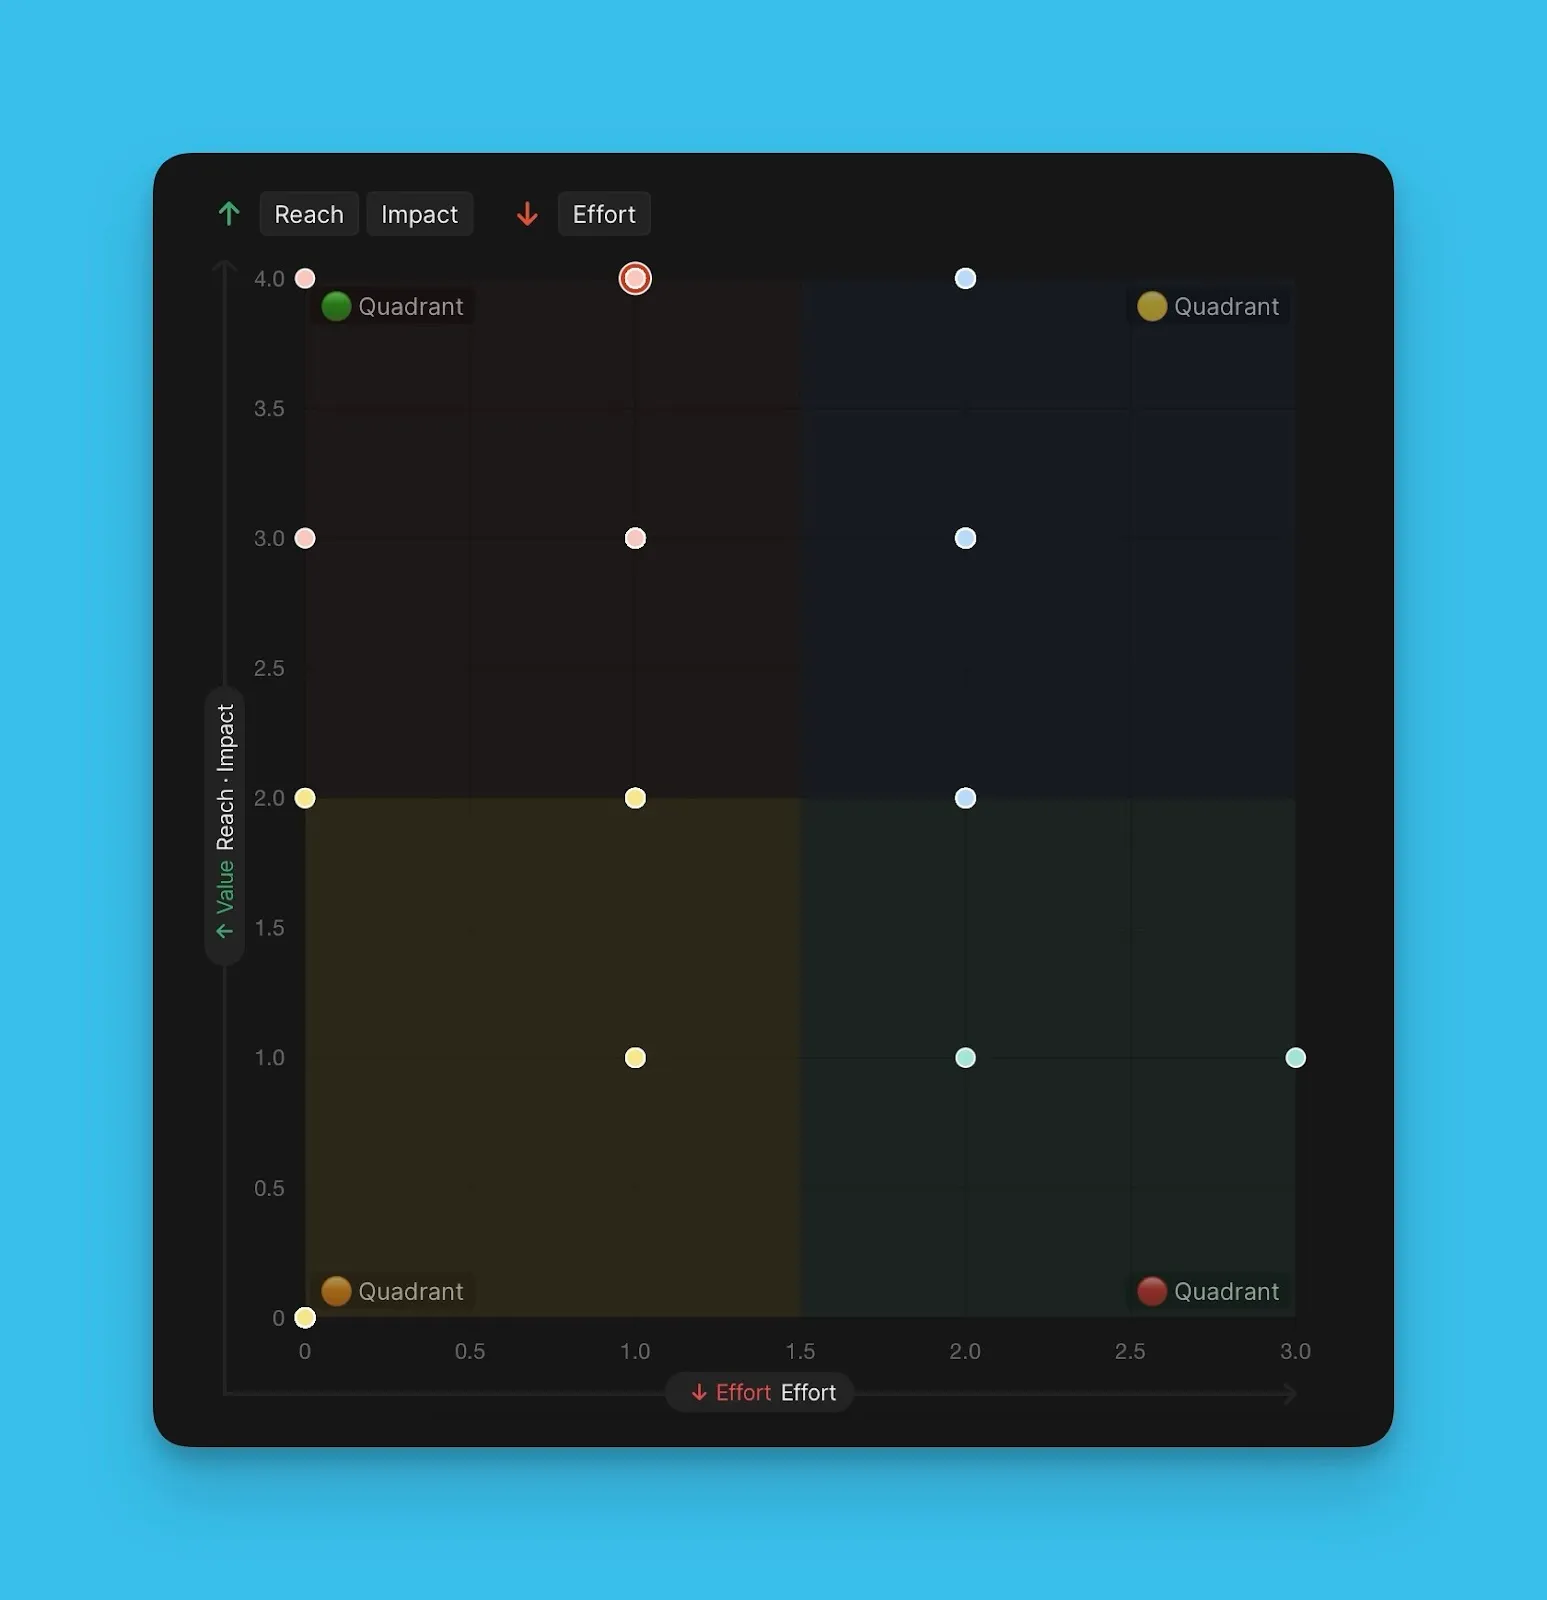
Matris sayfası Değer'i Efor'a göre çizen 2x2'lik bir ızgara gösterir. Bu görselleştirme, Eisenhower Matrisi yaklaşımını kullanarak öncelikli Kayıtları belirlemenize yardımcı olur.
Değer (y-ekseni) Efor'a (x-ekseni) göre çizilir. Izgara dört kadrana ayrılır:
-
Kadran 1 (Önce bunu yap): Yüksek Değer, Düşük Efor—en yüksek öncelik
-
Kadran 2 (Parçalara ayır): Yüksek Değer, Yüksek Efor
-
Kadran 3 (Boşluk doldurucu): Düşük Değer, Düşük Efor
-
Kadran 4 (Gerçek olamayacak kadar büyük): Düşük Değer, Yüksek Efor—en düşük öncelik
Matris görünümleri
Matris sayfası iki görselleştirme seçeneği sunar:
Liste görünümü: Her kadranda Kayıtları sıralı liste olarak gösterir; en yüksek öncelikli Kayıt en üsttedir.
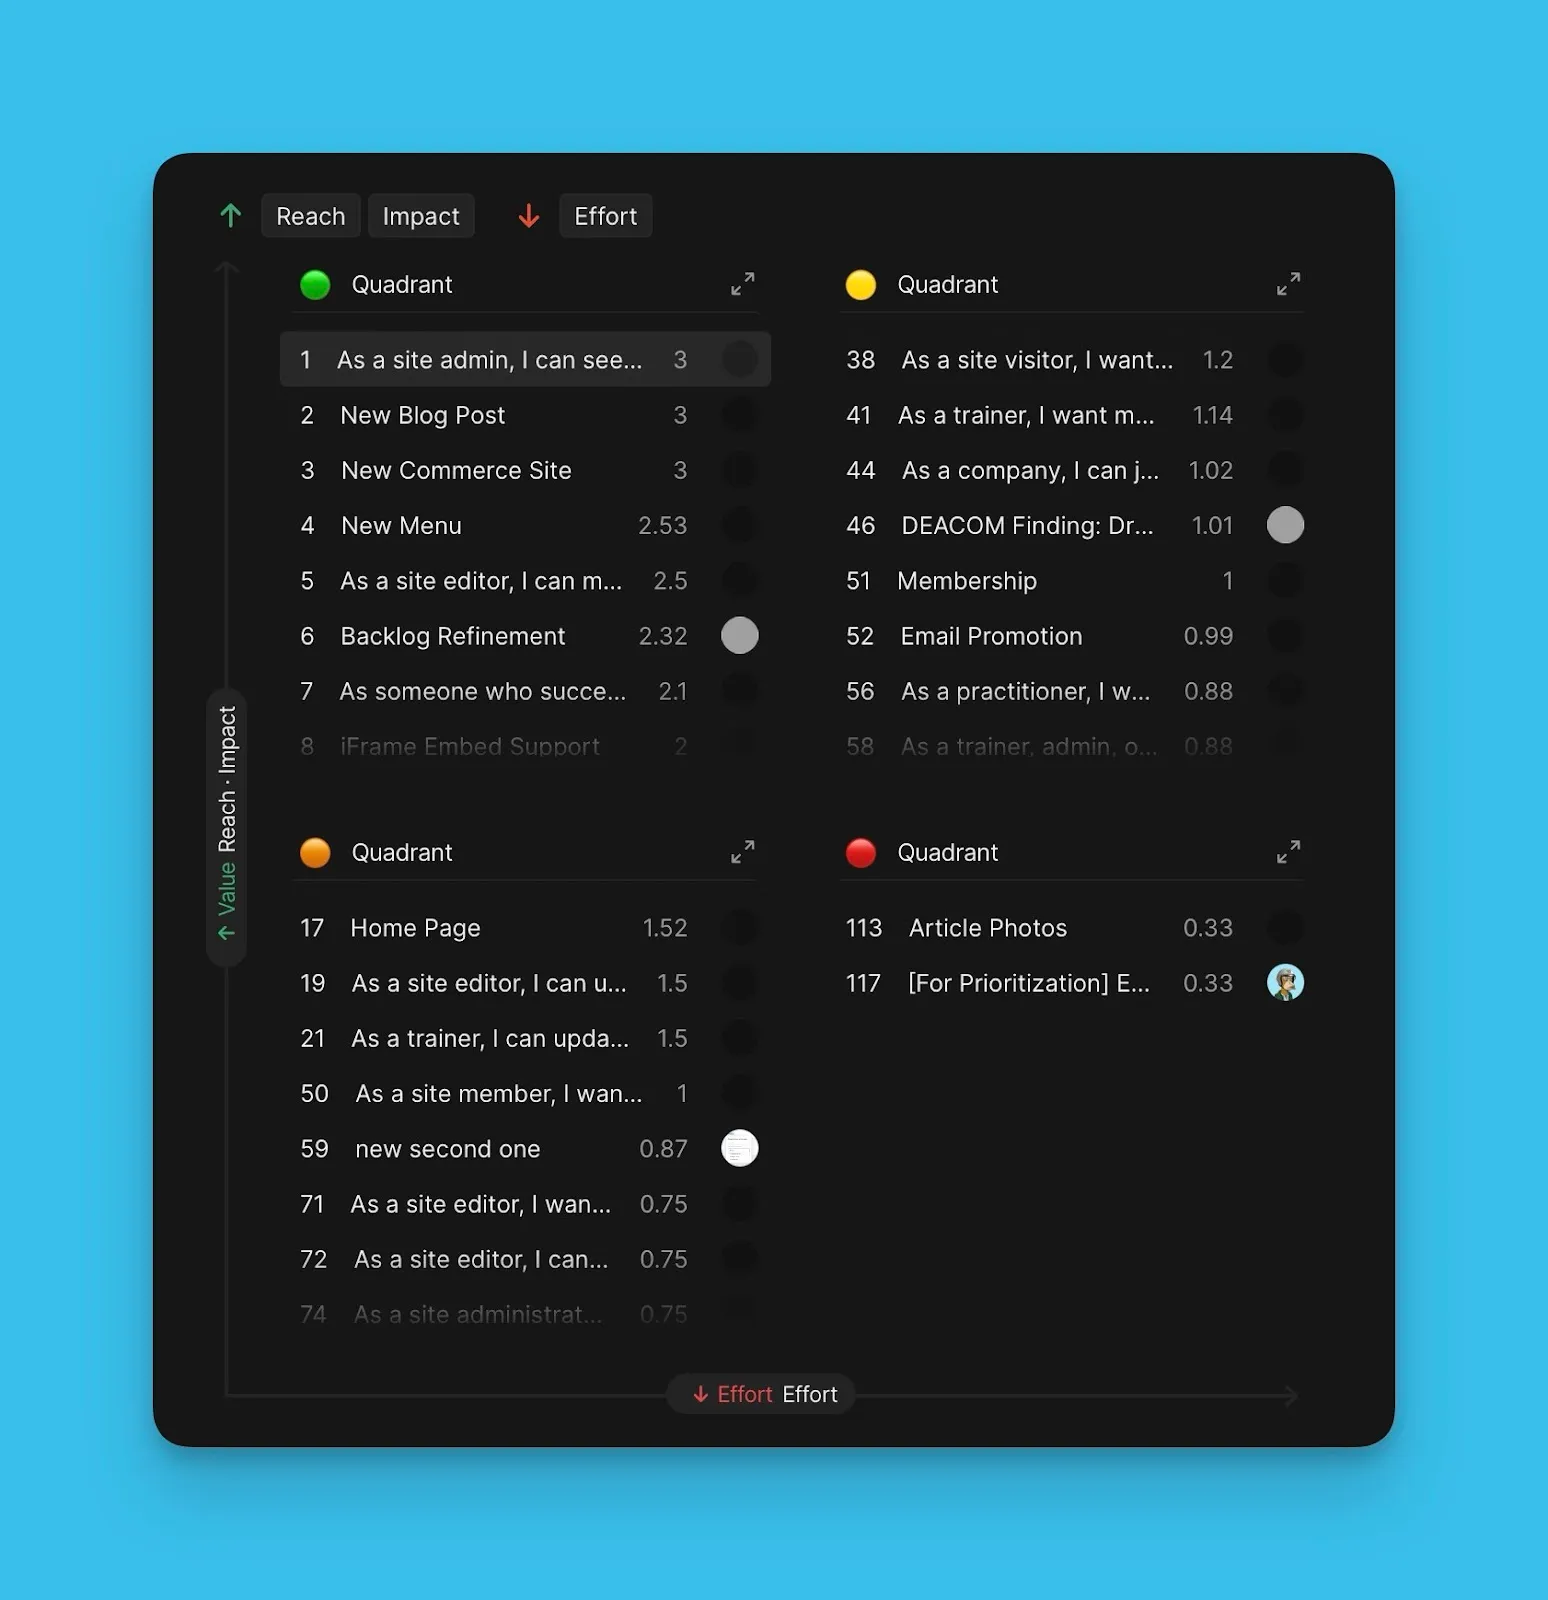
Grafik görünümü: Kayıtları matris ızgarası üzerinde konumlandırılmış renkli baloncuklar olarak gösterir ve her Kayıt'ın tam olarak nereye düştüğünü gösterir.
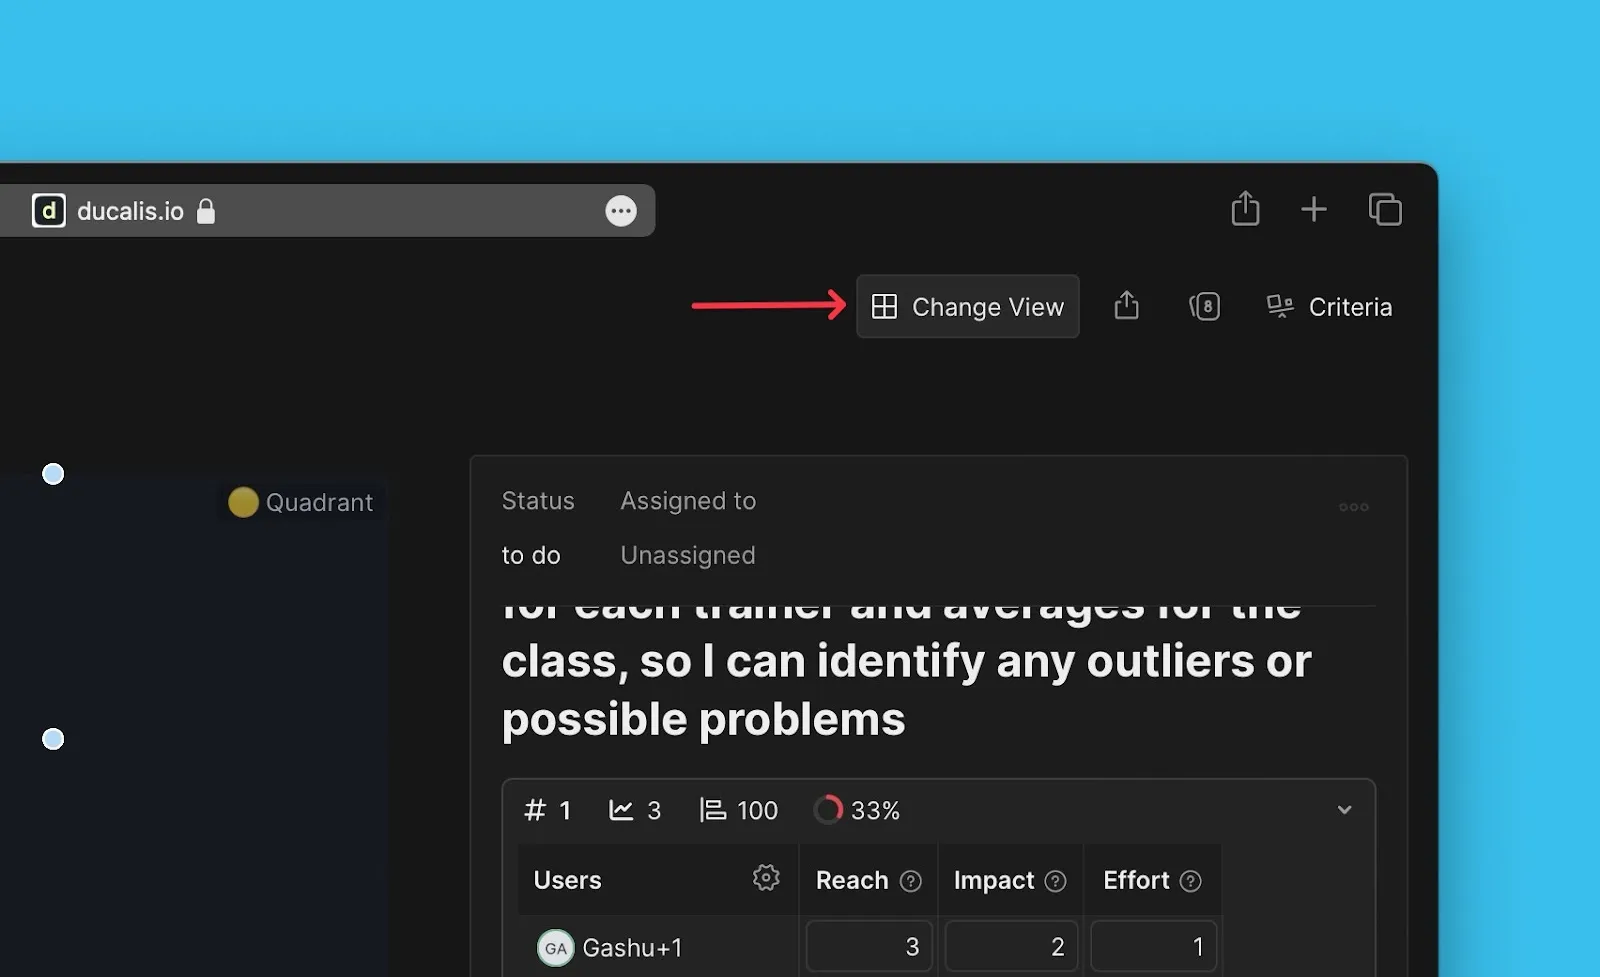
Görünümler arasında geçiş yapma
Liste görünümü ile Grafik görünümü arasında geçiş yapmak için Change View (Görünümü Değiştir) öğesine tıklayın.
Sırada ne var
Önceliklendirme sonuçlarını bir izleyici ile senkronize edin