Value vs Effort Prioritization
The Value vs Effort framework is the fastest path to smarter prioritization. This 2x2 matrix separates high-impact opportunities from resource drains by plotting initiatives against two dimensions: the value they deliver and the effort required. Teams using this approach consistently identify "quick wins" that deliver maximum ROI with minimum investment, while systematically avoiding "money pits" that consume resources without proportional returns. Whether you're grooming a product backlog, planning marketing campaigns, or managing enterprise projects, this guide covers everything.
What is the Value vs Effort framework?
The Value vs Effort framework (also called Impact vs Effort Matrix, Value vs Complexity Matrix, or Lean Prioritization Matrix) is a visual decision-making tool that evaluates tasks based on two fundamental questions: How much value will this deliver? and How much effort will it require?
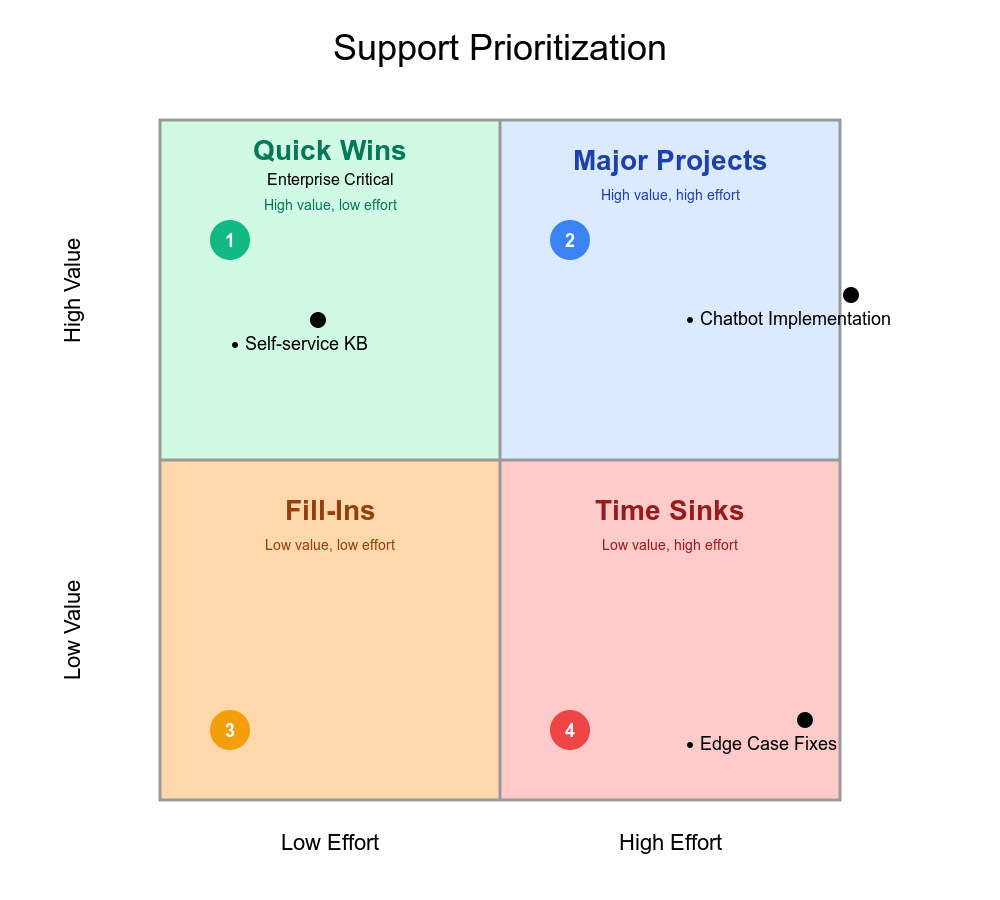
The framework creates a 2x2 grid with four distinct quadrants, each prescribing a different strategic action. Items plotted in the upper-left quadrant (high value, low effort) become top priorities, while those in the lower-right (low value, high effort) get eliminated or reconsidered. The genius lies in its simplicity—complex prioritization decisions become visually intuitive.
The approach is built on fundamental cost-benefit analysis principles. As product management experts describe it: "It's the act of weighing the potential ROI of a task against the resources it demands, ensuring the highest value tasks get precedence." This framework has become ubiquitous across Six Sigma, Agile, Lean methodologies, and design thinking because it translates abstract tradeoffs into actionable visual guidance.
Common alternative names include:
- Impact vs Effort Matrix (prevalent in quality management)
- Value vs Complexity Matrix (product management terminology)
- Action Priority Matrix or 4-Square Matrix (project management)
- Lean Prioritization Matrix (Agile contexts)
The four quadrants define your action strategy
Each quadrant carries specific characteristics and strategic implications. Understanding these distinctions transforms the matrix from a simple visualization into a powerful decision-making engine.
Quick Wins: pursue immediately (high value, low effort)
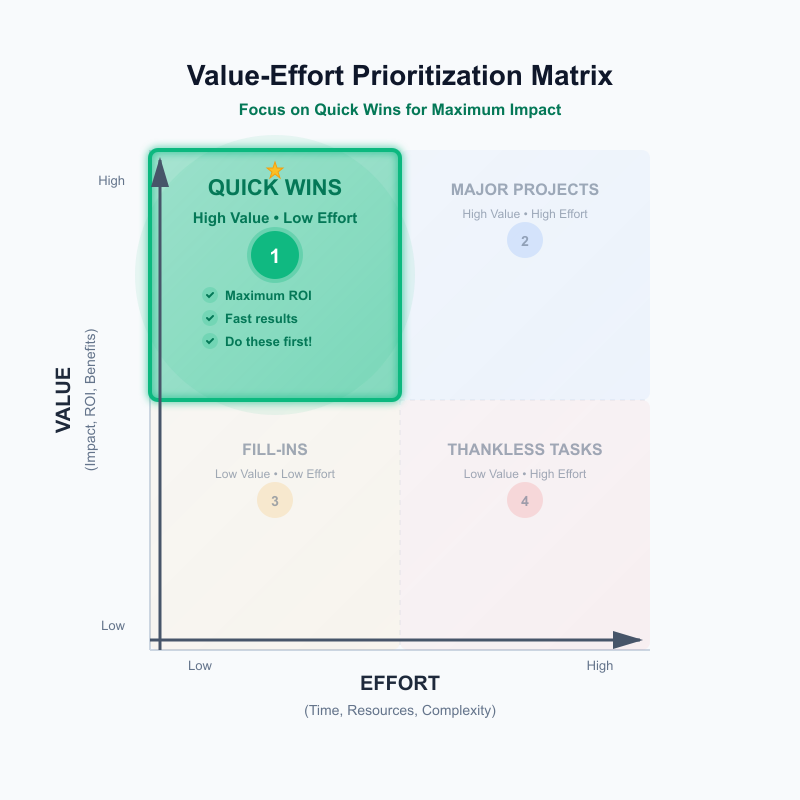
Items in this quadrant represent low-hanging fruit—opportunities delivering significant impact with minimal resource investment. These should be your top priority and typically get implemented first. Examples include improving button labels for better conversion, adding FAQ content that reduces support tickets, or fixing a common user error with a simple code change.
The strategic approach is straightforward: do these immediately. Quick Wins deliver instant ROI and build momentum. One caveat from product experts: if genuine Quick Wins exist and are truly easy, "you probably will have already completed them." Finding items here often signals either fresh discovery or previous oversight.
Major Projects: plan carefully (high value, high effort)
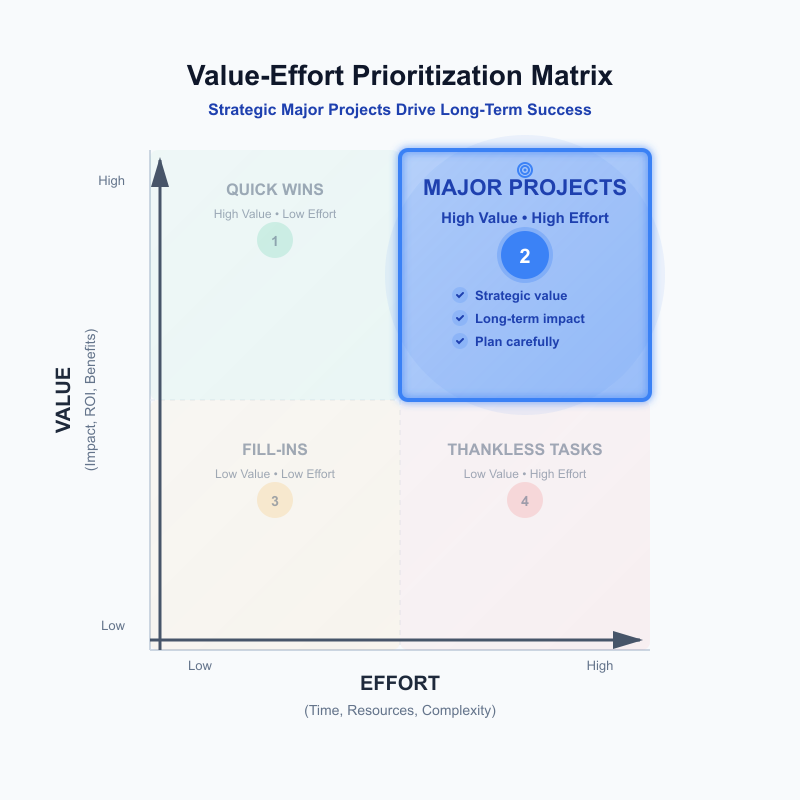
High-value items requiring significant resources belong here—strategic investments like launching new product lines, platform rewrites, or market expansion initiatives. These become competitive differentiators when executed well, justifying their substantial resource requirements.
The strategic approach: prioritize after Quick Wins. Major Projects require careful planning, prototyping, and phased execution. Consider breaking them into smaller deliverables that can be validated incrementally. These items belong on strategic roadmaps with proper resourcing commitments rather than immediate sprint backlogs.
Fill-Ins: use for gap-filling (low value, low effort)
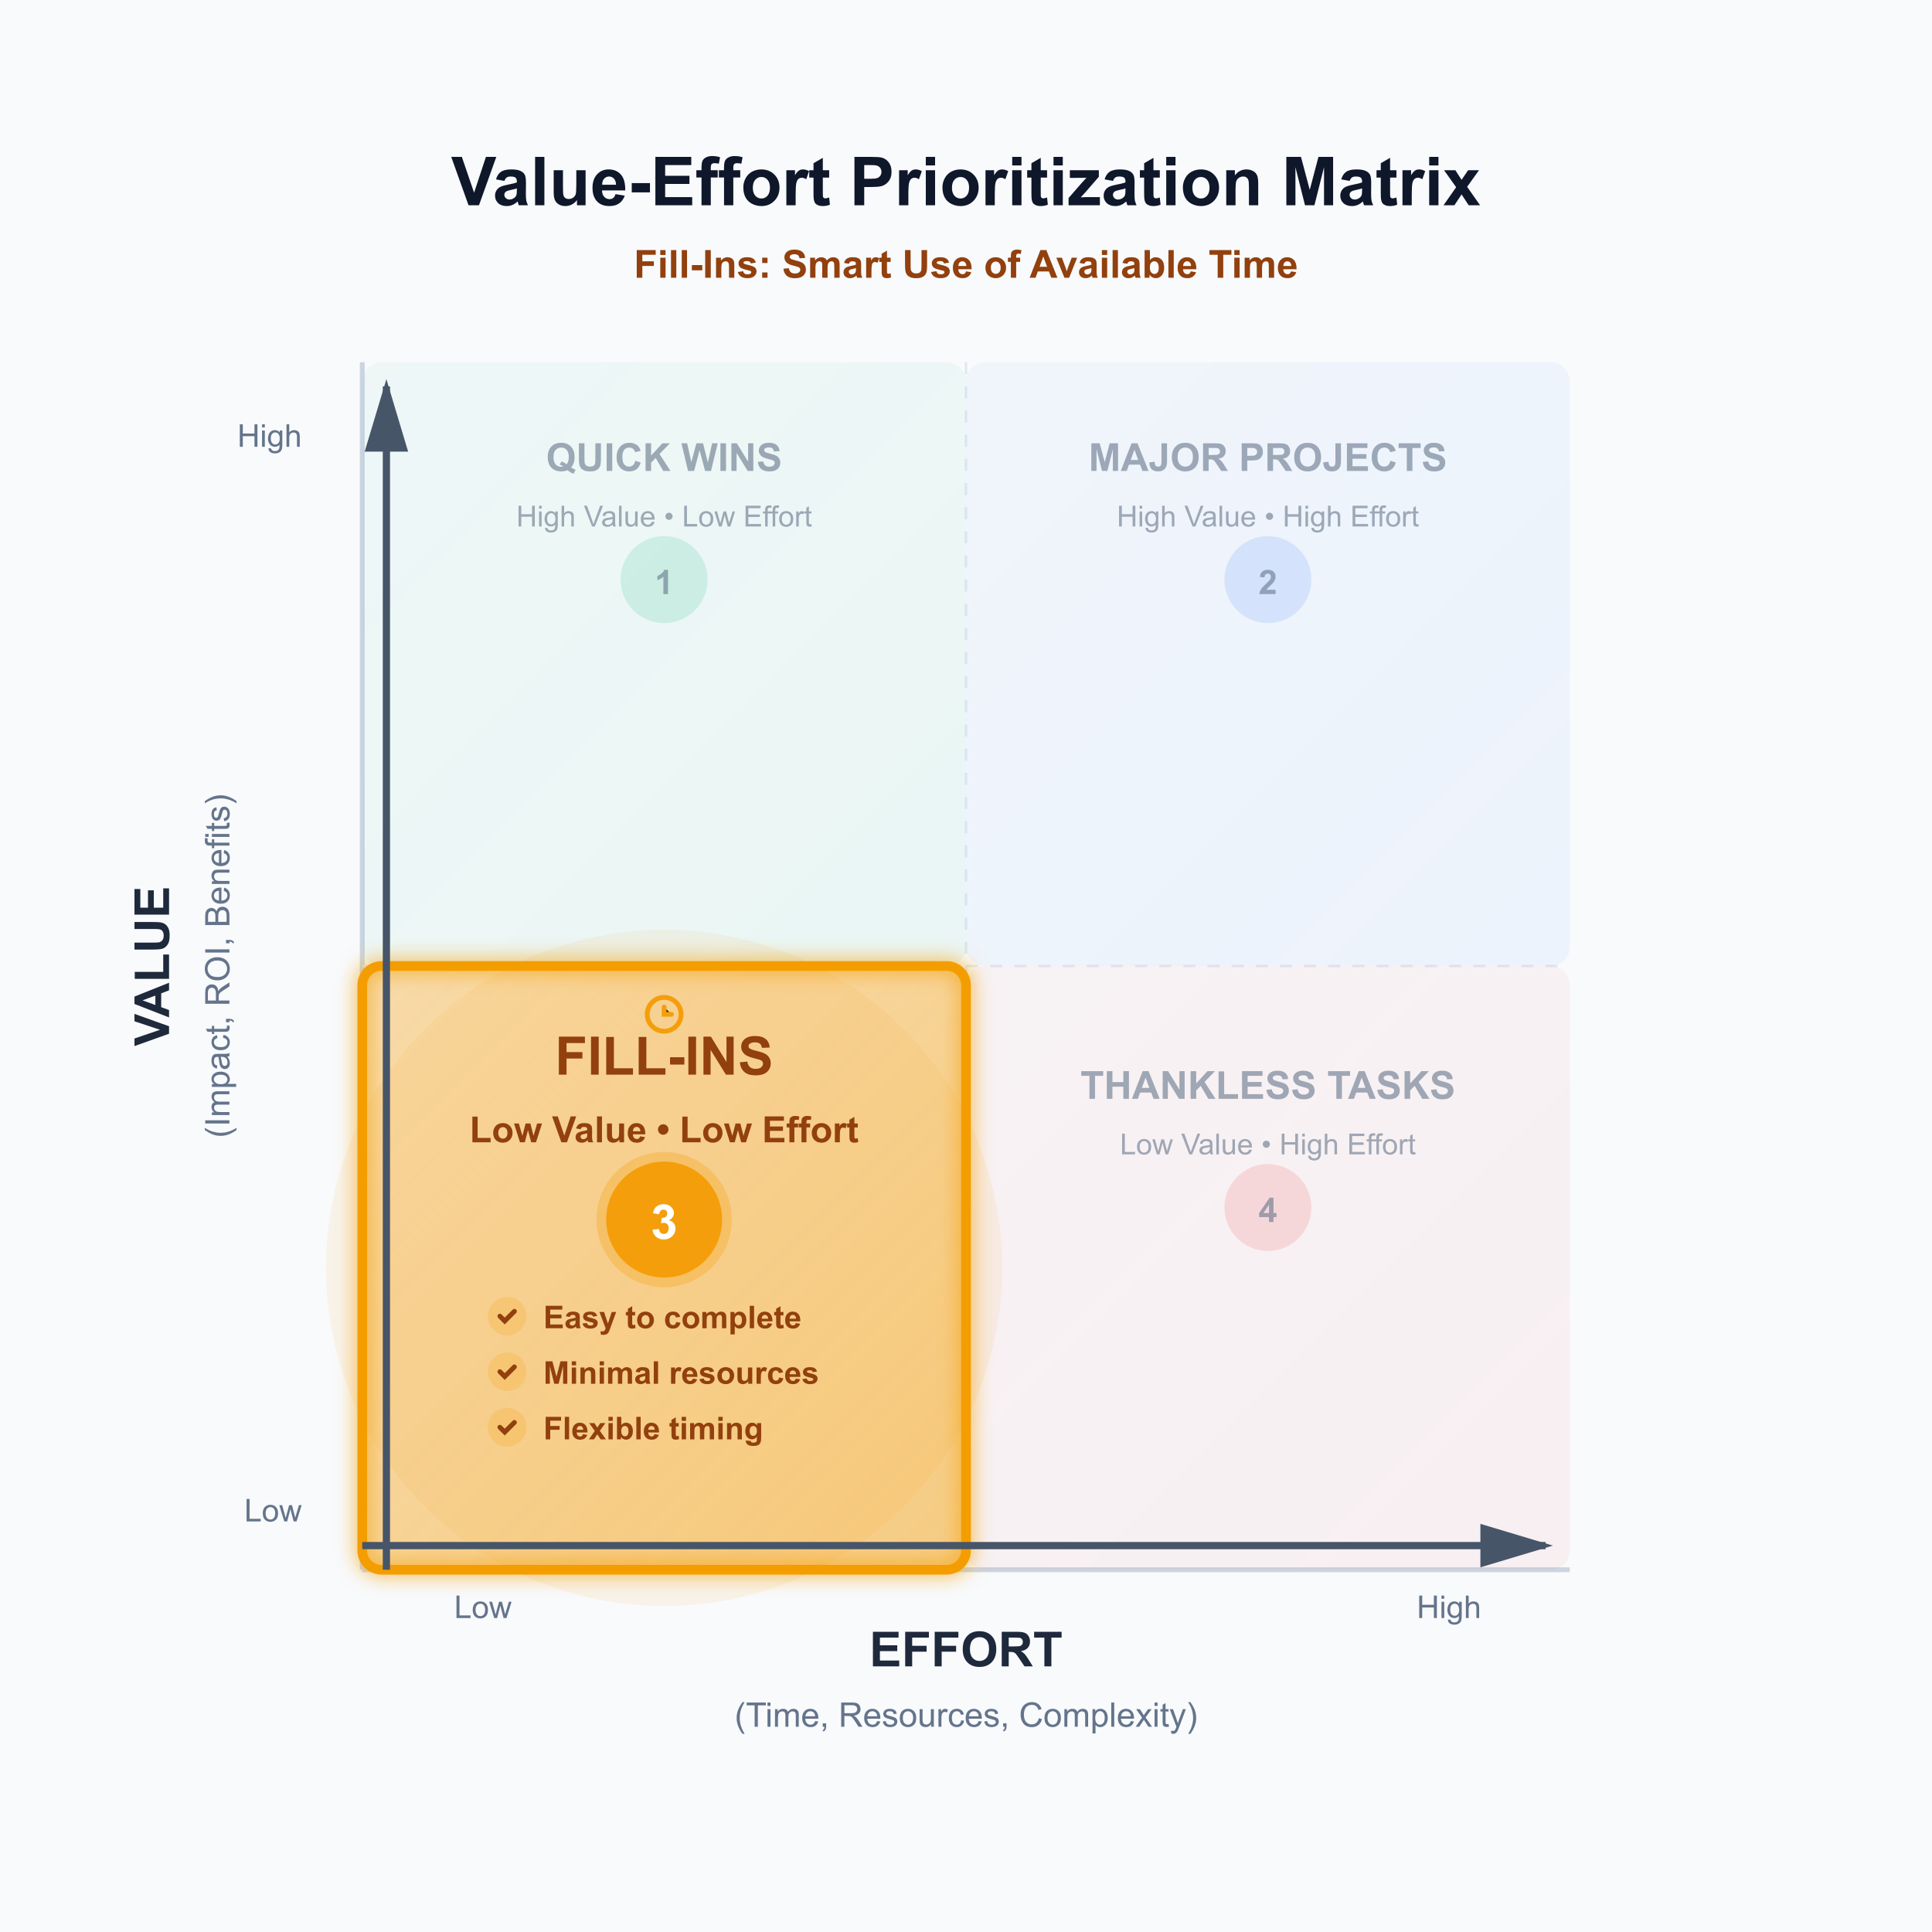
Items here are easy to complete but don't dramatically affect business trajectory—minor UI tweaks, documentation updates, or small convenience features. They're "nice-to-have" elements representing low risk with limited payoff.
The strategic approach: complete during downtime. Fill-Ins work well when developers have capacity between larger projects or when sprints need padding. They provide small wins without significant resource expenditure. Some teams call these "wildcard" items worth adding when opportunity allows.
Thankless Tasks: avoid or eliminate (low value, high effort)
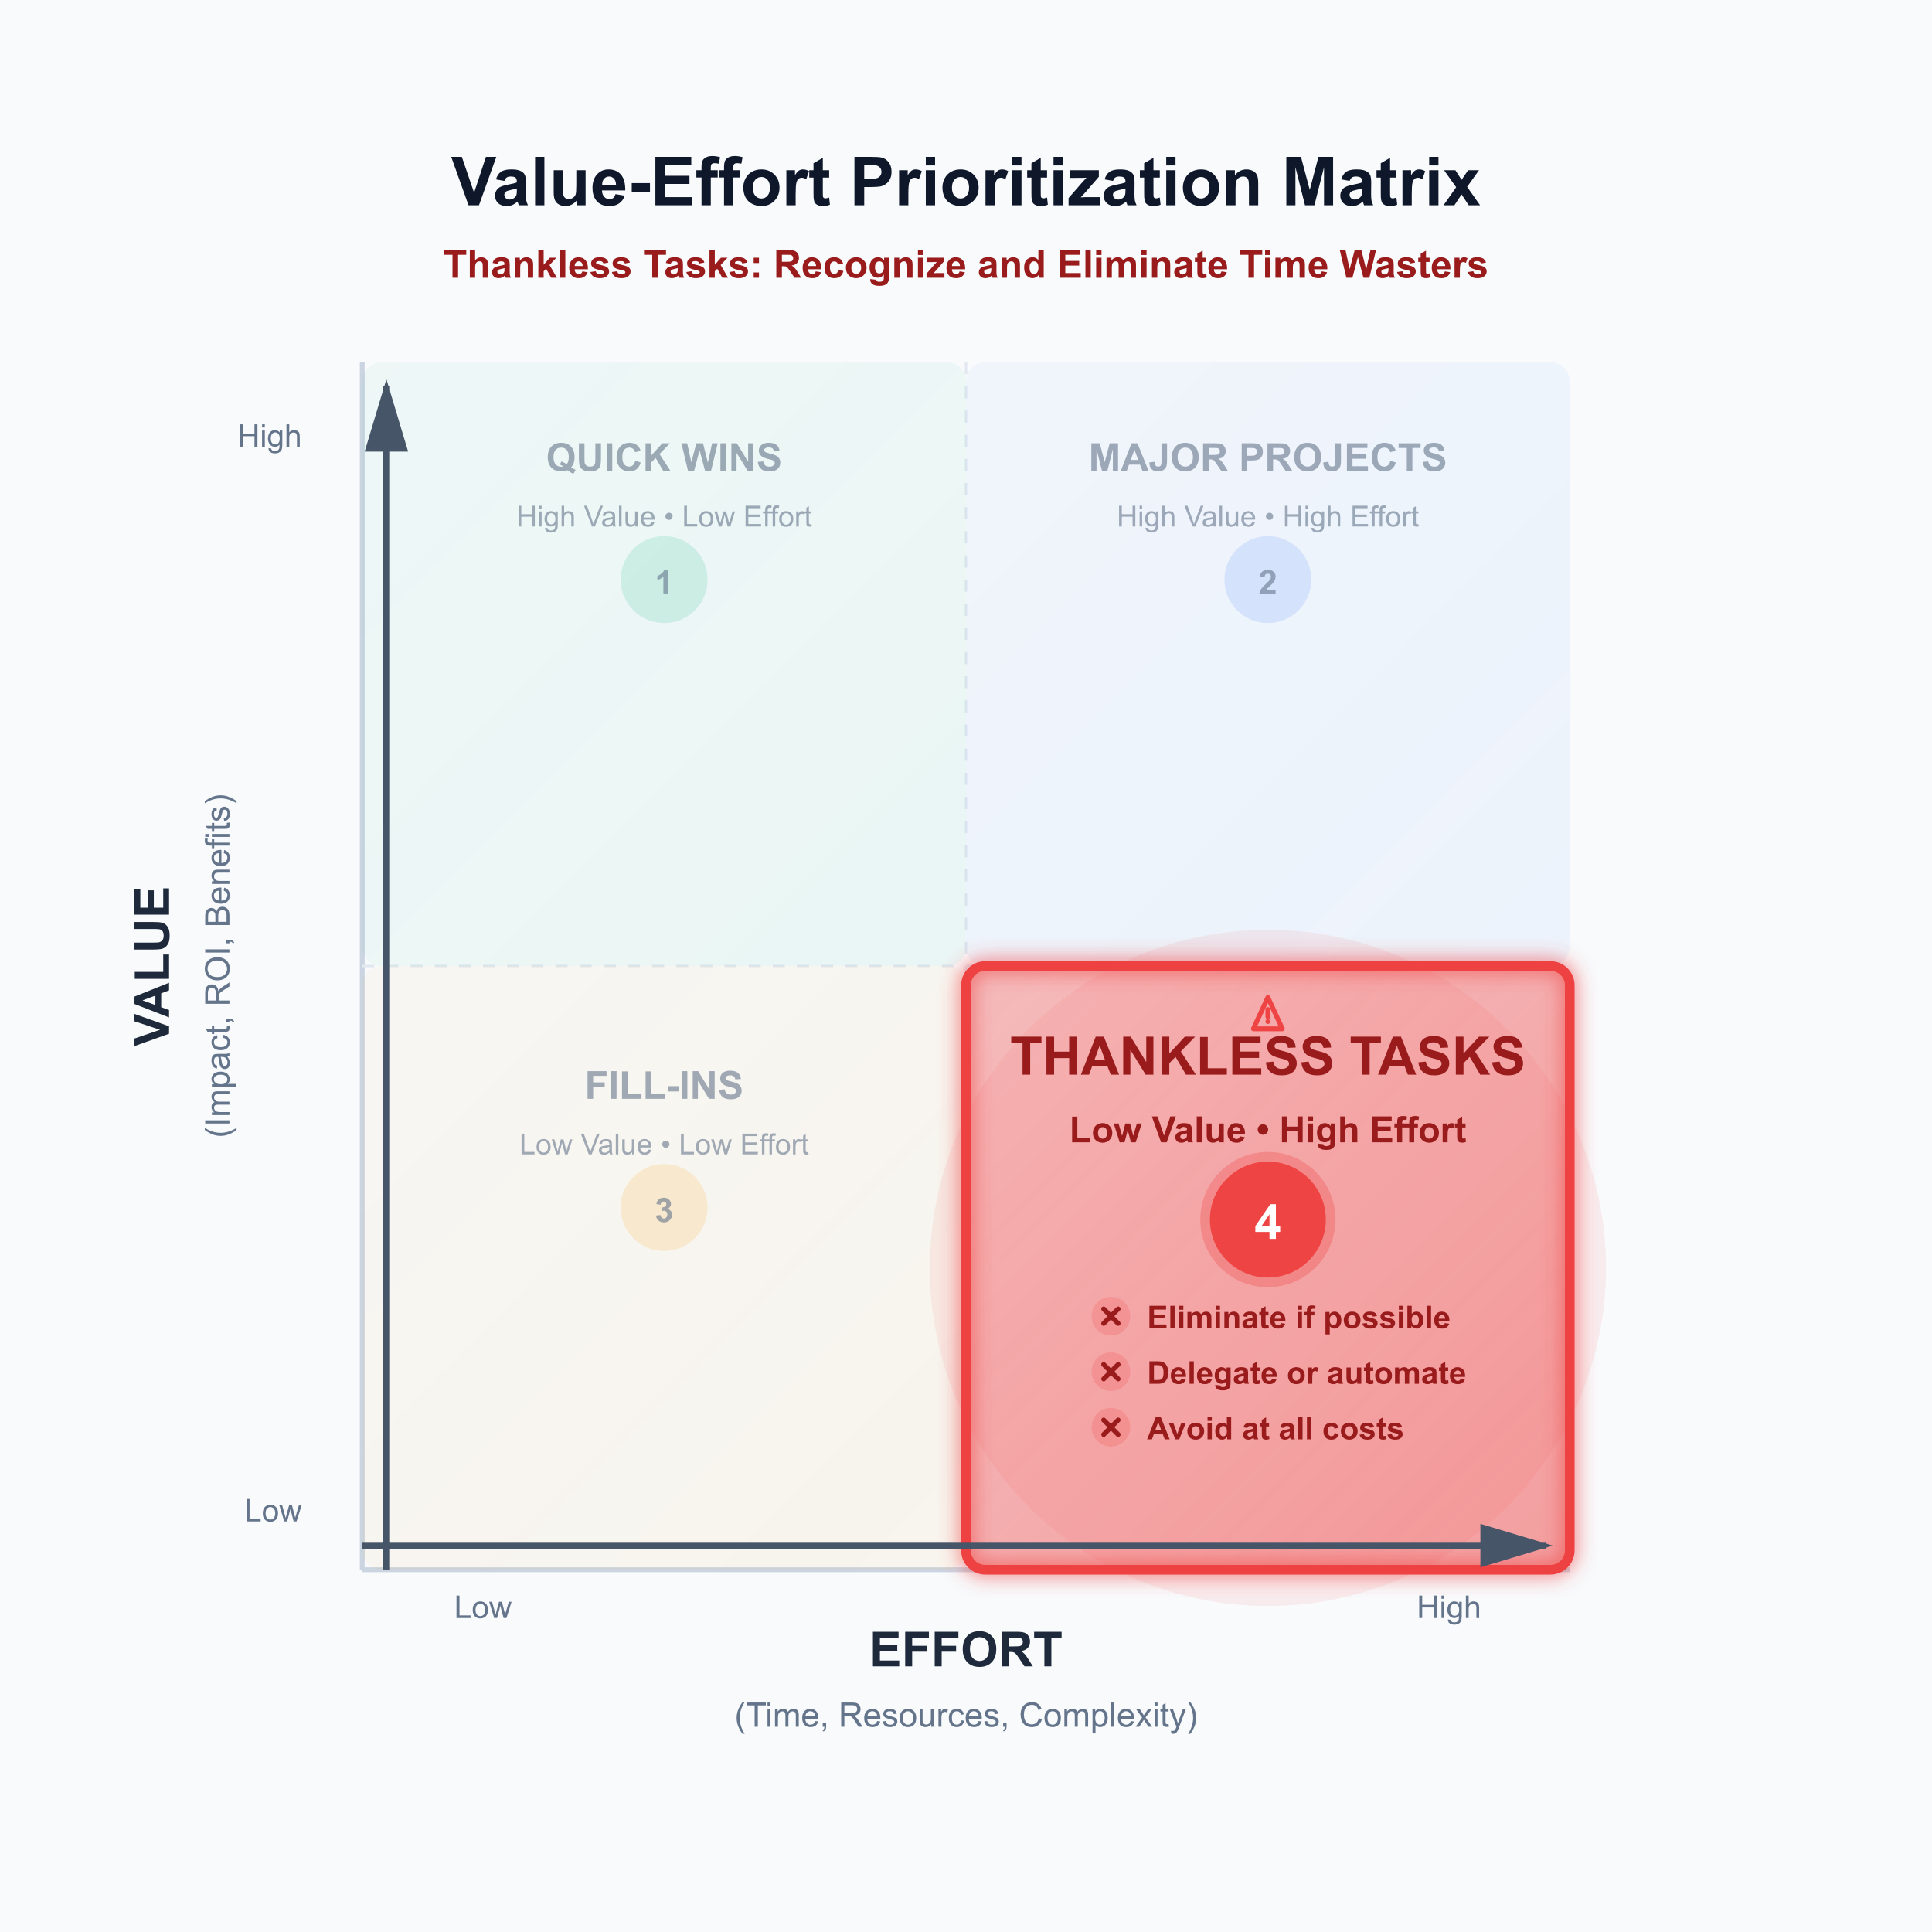
This quadrant identifies resource drains offering little return on investment—complex features few users want, over-engineered solutions, or legacy system rewrites with marginal benefit. These items consume time and energy that could serve higher-value work.
The strategic approach: do not prioritize. Cross these items off entirely or radically reconsider the solution approach. As product planning experts note, "one of the best reasons to use this model is to help your team identify these low-value, high-effort initiatives" before resources get wasted.
Items aren't static. A Fill-In requiring more effort than expected becomes a Time Sink. A Major Project losing its impact rationale may need elimination. Regularly reassess placement as new information emerges.
Framework variations address different contexts
Several variations adapt the basic 2x2 structure for specific use cases:
| Variation | Key Difference | Best Application |
|---|---|---|
| Value vs Complexity | "Complexity" encompasses technical difficulty plus organizational challenges | Development team planning |
| Impact vs Effort | "Impact" specifically references user or business outcomes | UX design, Six Sigma |
| Cost-Benefit Matrix | Uses monetary values for both dimensions | Financial and strategic decisions |
| RICE Framework | Adds Reach and Confidence factors; formula: (R × I × C) ÷ E | Data-driven organizations |
| ICE Scoring | Adds only Confidence to Impact and Ease | Mid-complexity prioritization |
The RICE framework, developed by Intercom, represents the most significant evolution. By adding Reach (how many users affected) and Confidence (certainty in estimates), RICE addresses two key limitations of basic Value/Effort assessment: it accounts for feature audience size and penalizes uncertain projections.
When to choose Value vs Effort over other frameworks
Different frameworks serve different decision contexts. Choosing the right tool requires understanding what each approach optimizes for.
Choose Value vs Effort when:
- Speed matters more than precision
- Teams need visual communication for stakeholder alignment
- You're working with early-stage products having limited data
- Sprint-level or tactical prioritization is the goal
- Participants are new to structured prioritization
Choose RICE when:
- You need to compare many features objectively with numerical ranking
- Have data on reach and impact available
- Must justify decisions to stakeholders with quantifiable rationale
- Want to penalize low-confidence estimates explicitly
Choose MoSCoW when:
- Defining release boundaries or MVP scope
- Managing stakeholder expectations on what's in/out
- Need simple categorical (Must/Should/Could/Won't) rather than scored prioritization
Choose ICE when:
- Running weekly or bi-weekly prioritization cycles for growth experiments
- "Good-enough" decisions unblock learning faster than perfect analysis
- Confidence variation significantly affects priorities
Choose Kano Model when:
- Understanding how features affect customer satisfaction is paramount
- Need to identify features that actually cause dissatisfaction
- Have capacity for customer research and surveys
Choose Weighted Scoring when:
- Multiple stakeholders have legitimately different priority criteria
- Complex enterprise decisions require considering many factors
- Need documented, defensible decision rationale
Strengths of the Value vs. Effort Model
The framework's advantages explain its widespread adoption:
- Simplicity: No elaborate calculations or specialized training required
- Visual clarity: 2x2 representation makes priorities immediately apparent
- Speed: Enables rapid prioritization without extensive analysis
- Flexibility: Value and Effort definitions adapt to organizational context
- Alignment: Creates shared language facilitating team consensus
- Accessibility: Anyone can participate regardless of technical background
These strengths make Value vs Effort ideal for collaborative workshops, cross-functional alignment sessions, and situations requiring quick decisions with limited data.
Key Limitations of Value–Effort Framework
Critical research reveals significant weaknesses teams must address:
Subjectivity risk: Scores often reflect gut feeling rather than data. Different evaluators may score identical items very differently, creating inconsistency.
Estimation bias: Microsoft research found experts are "bad at estimating the value of features." Harvard Business School's John Gourville found teams overestimate value impact by a factor of 9, while consistently underestimating effort by 2-3x. This means items predicted as "Quick Wins" often end up as "Money Pits."
Missing dimensions: The framework ignores urgency, dependencies, strategic alignment, risk, and time sensitivity. It doesn't capture confidence levels or account for negative outcomes—some features actually hurt metrics.
Oversimplification: Complex decisions reduced to a simple grid may miss crucial nuances. Two factors cannot capture all relevant decision criteria for sophisticated organizations.
Static snapshots: Without regular updates, scores become outdated as market conditions change, rendering the matrix misleading.
Value–Effort Framework in Practice Across Teams
Software and product teams
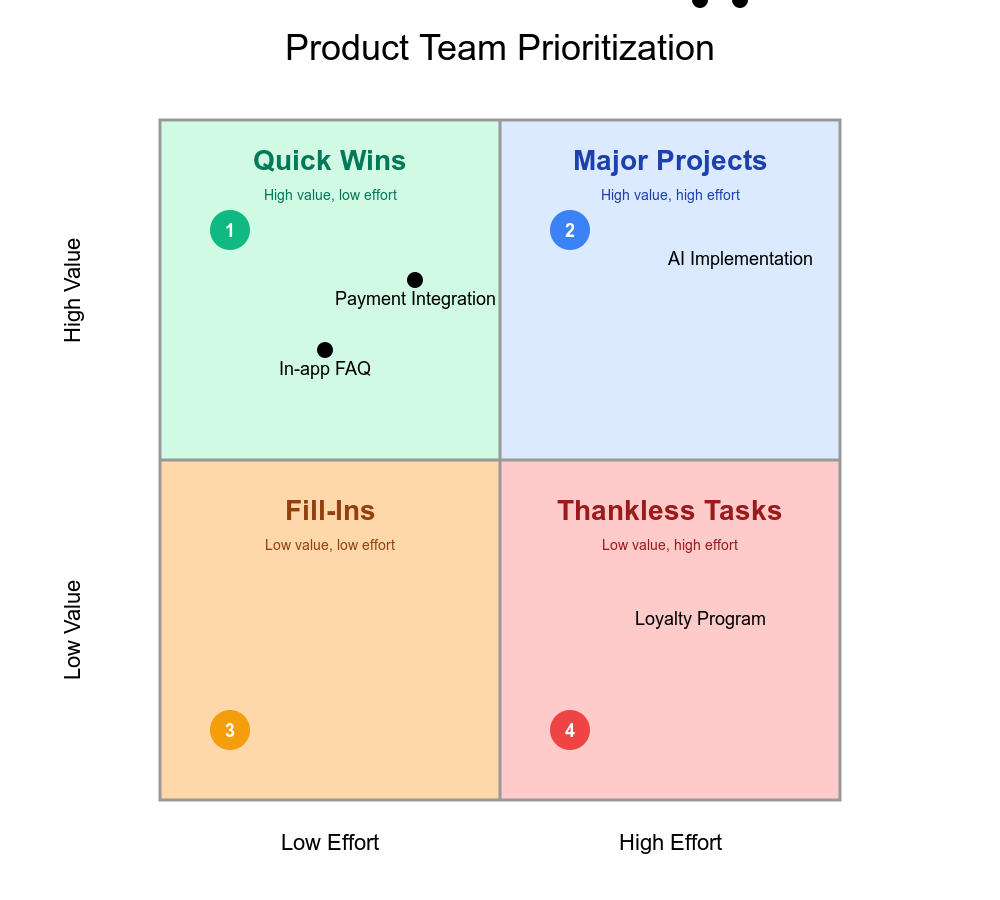
Product managers use Value vs Effort extensively for feature prioritization, plotting potential features to determine what belongs in the next release versus future roadmaps. During backlog grooming, the framework prevents backlogs from becoming feature "dumps" by identifying Money Pit items before they consume sprint capacity.
Specific applications include:
- Comparing payment integration (high value, low effort) against loyalty programs (lower ROI)
- Identifying in-app FAQ (Quick Win) versus AI implementation (Major Project)
- Balancing Quick Wins with Major Projects within sprint capacity
Marketing teams
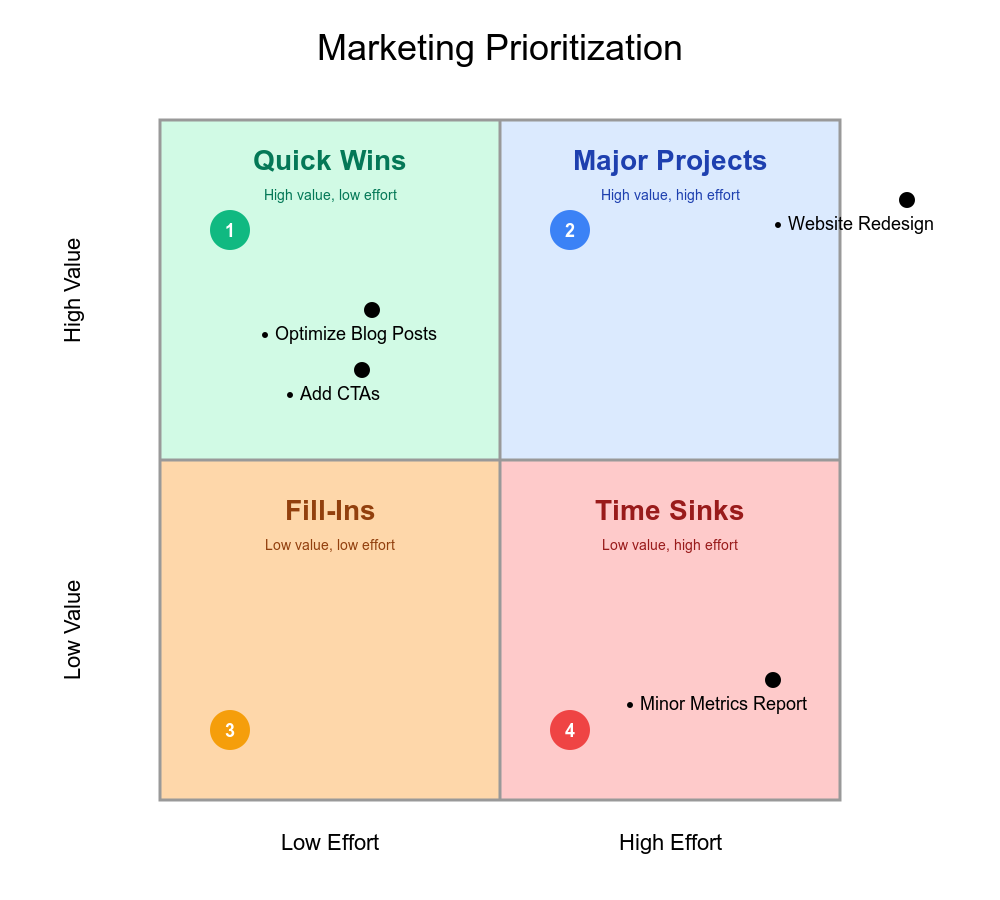
Marketing applies the framework for campaign prioritization and channel selection. Regular social posting continues as low-hanging fruit while major campaigns launch for new product lines. Teams evaluate email, social, paid media, and content channels by effort versus impact.
Quick Wins might include optimizing high-performing blog posts or adding CTAs to existing pages. Major Projects encompass website redesigns or long-form content campaigns. Time Sinks often include detailed reporting on minor metrics or non-essential conference attendance.
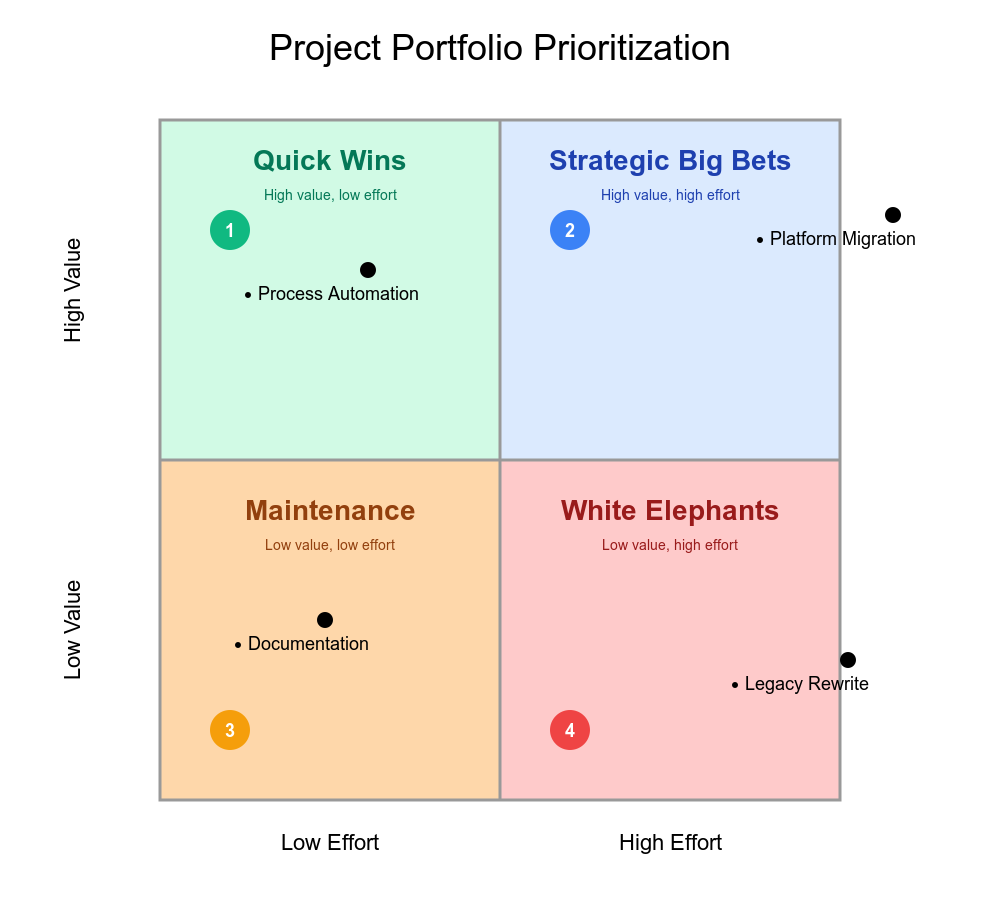
Project management and operations
Project managers combine the matrix with resource allocation decisions, preventing expenditure on "white elephant" projects consuming resources without proportional return. Portfolio management uses matrices to compare multiple projects simultaneously, balancing strategic Big Bets with tactical Quick Wins.
Customer support and success
Support teams apply priority matrices combining impact/effort with client tier weighting. Critical issues affecting revenue for enterprise clients become Priority 1. Similar issues for smaller clients become Priority 2. The approach removes guilt from prioritization by making criteria explicit and defensible.
Feature requests get scored by cumulative MRR of requesting customers—calculating the total monthly recurring revenue from all customers who requested a feature creates more precise value assessment than arbitrary scoring.
Startup versus enterprise considerations
Startups favor Value vs Effort because simplicity matches their speed requirements. When every sprint matters and extensive data analysis isn't feasible, quick visual prioritization becomes essential for MVP development and resource-constrained decisions.
One startup initially prioritized technically impressive portfolio tracking features—high effort items that underperformed because value-to-effort ratio was lower than assumed. Adjusting focus to AI-powered insights (higher leverage) improved outcomes. The lesson: "Misallocating even a few sprints to the wrong features can dramatically reduce runway."
Enterprise teams often layer additional frameworks. Strategic planning may use WSJF or weighted scoring while team-level sprint planning uses Value/Effort. Formal criteria definitions become necessary across large organizations to ensure consistent interpretation.
What is Value?
In the matrix, the “value” dimension refers to the benefits or impact a feature will have. How you measure this depends a ton on what your business goals are. Value should encompass multiple dimensions rather than single metrics:
User value includes customer satisfaction improvement, user problem resolution, number of users affected, and feature request frequency from customers.
Business value encompasses revenue potential (new acquisition, upsells), Monthly Recurring Revenue of requesting customers, market differentiation, retention impact, and churn prevention.
Strategic alignment considers alignment with product vision, market positioning, long-term objectives, and return on investment.
Quantification approaches include:
- Cumulative MRR method: Sum the MRR of all customers requesting a feature
- Feature request counting: Number of users/customers requesting functionality
- Customer segment weighting: Prioritize features requested by high-value segments
- Revenue estimation: Projected revenue impact calculations
Best practice requires stakeholder input during value definition—conducting interviews to capture diverse perspectives, including customer-facing teams in assessment, and defining criteria collaboratively before scoring begins.
What is Effort?
Effort is how much work a feature will be. It could include:
Development time: Developer hours/days, person-months across product, design, and engineering teams.
Resource requirements: Overall resource hours, in-house skill availability, cross-team dependencies.
Complexity factors: Technical complexity, work volume, uncertainty and implementation risks, integration requirements.
Risk considerations: Failure probability, technology obsolescence, dependency on specific team members.
Estimation methods
You can use rough T-shirt sizes (Small, Medium, Large, Xtra large) to estimate the effort for each feature, or you can get more specific and use story points or product development hours.
| Method | Best For | Pros | Cons |
|---|---|---|---|
| T-Shirt Sizing (XS-XXL) | High-level roadmapping, teams new to Agile | Simple, intuitive, encourages discussion | Less granular, can't calculate velocity |
| Story Points (Fibonacci) | Sprint planning, mature teams | Enables velocity tracking, data-driven forecasting | Can be confused with time, requires calibration |
| Time-Based (Hours/Days) | Detailed task planning, mature projects | Concrete, easy to understand | Creates artificial pressure, often inaccurate |
A hybrid approach works well: use T-shirt sizing for early project stages, shift to Story Points for user story-level planning, convert to time estimates only for discrete, well-defined tasks.
Avoiding Common Prioritization Mistakes
Over/underestimating systematically: Teams consistently underestimate effort by 2-3x due to planning fallacy. Validate estimates with development teams before finalizing, use historical data to calibrate, and retrospect regularly on estimation accuracy.
Biasing value assessment: Product managers often assign arbitrary scores based on gut feeling. Ground estimates in customer feedback data (feature request counts, MRR), require evidence for value claims, and include diverse stakeholders.
Ignoring dependencies: The matrix doesn't show task interconnections. Use story mapping to visualize dependencies, note them explicitly in discussions, and consider sequencing requirements when ordering backlogs.
Static scoring: Scores become outdated as market conditions change. Schedule regular re-evaluation sessions, update scores when new data emerges, and treat the matrix as a living document rather than fixed truth.
Overloading Quick Wins: Some teams jam too many items into this quadrant through wishful thinking. Maintain honest assessment and balance with strategic high-effort items that build long-term competitive advantage.
Handling disagreements requires voting mechanisms (Priority Poker, dot voting), hypothesis justification for every estimate, facilitated discussion on outliers, and clear authority for breaking ties when consensus fails.
Set up Value vs Effort in Ducalis
Ducalis extends the basic 2x2 matrix with weighted scoring, team voting, and deep task tracker integrations. Here's how to implement the framework:
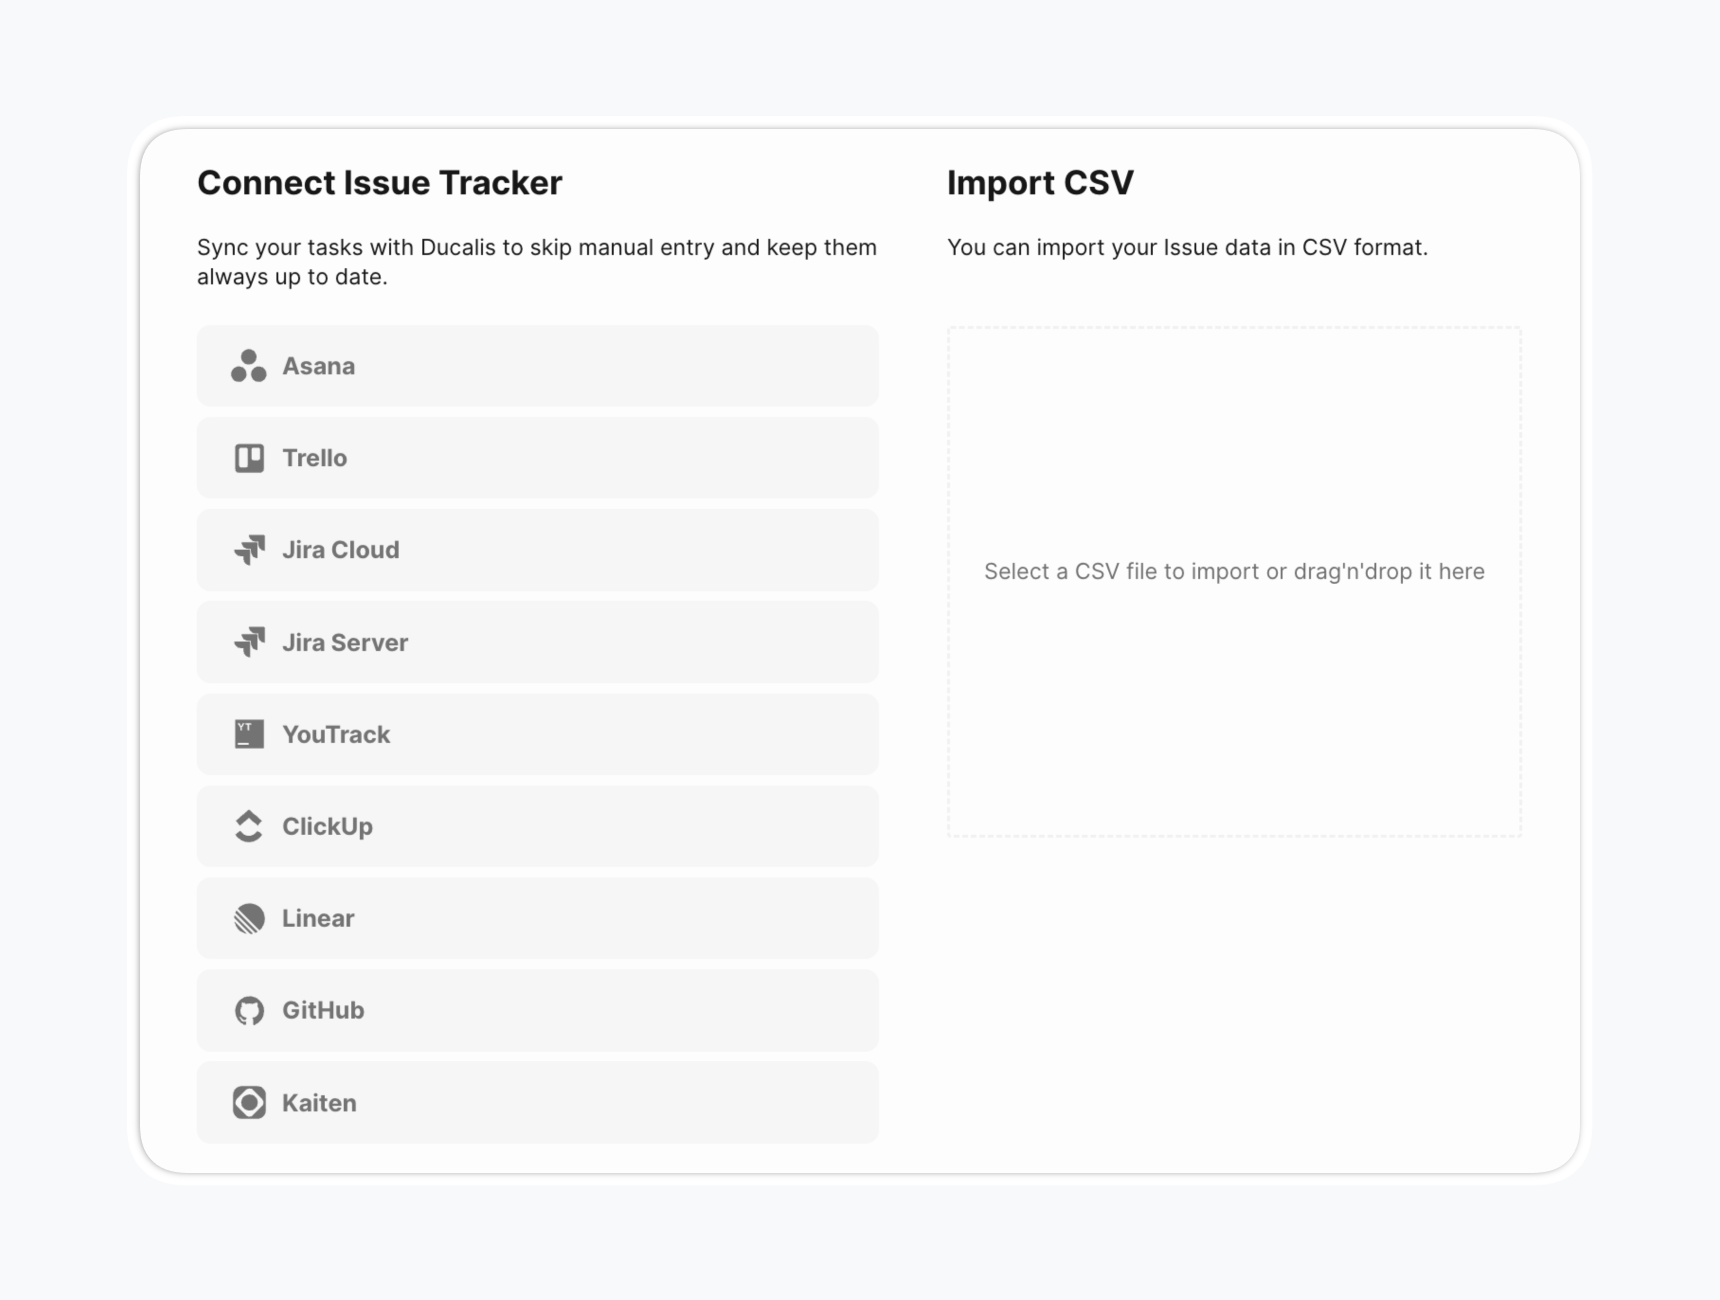
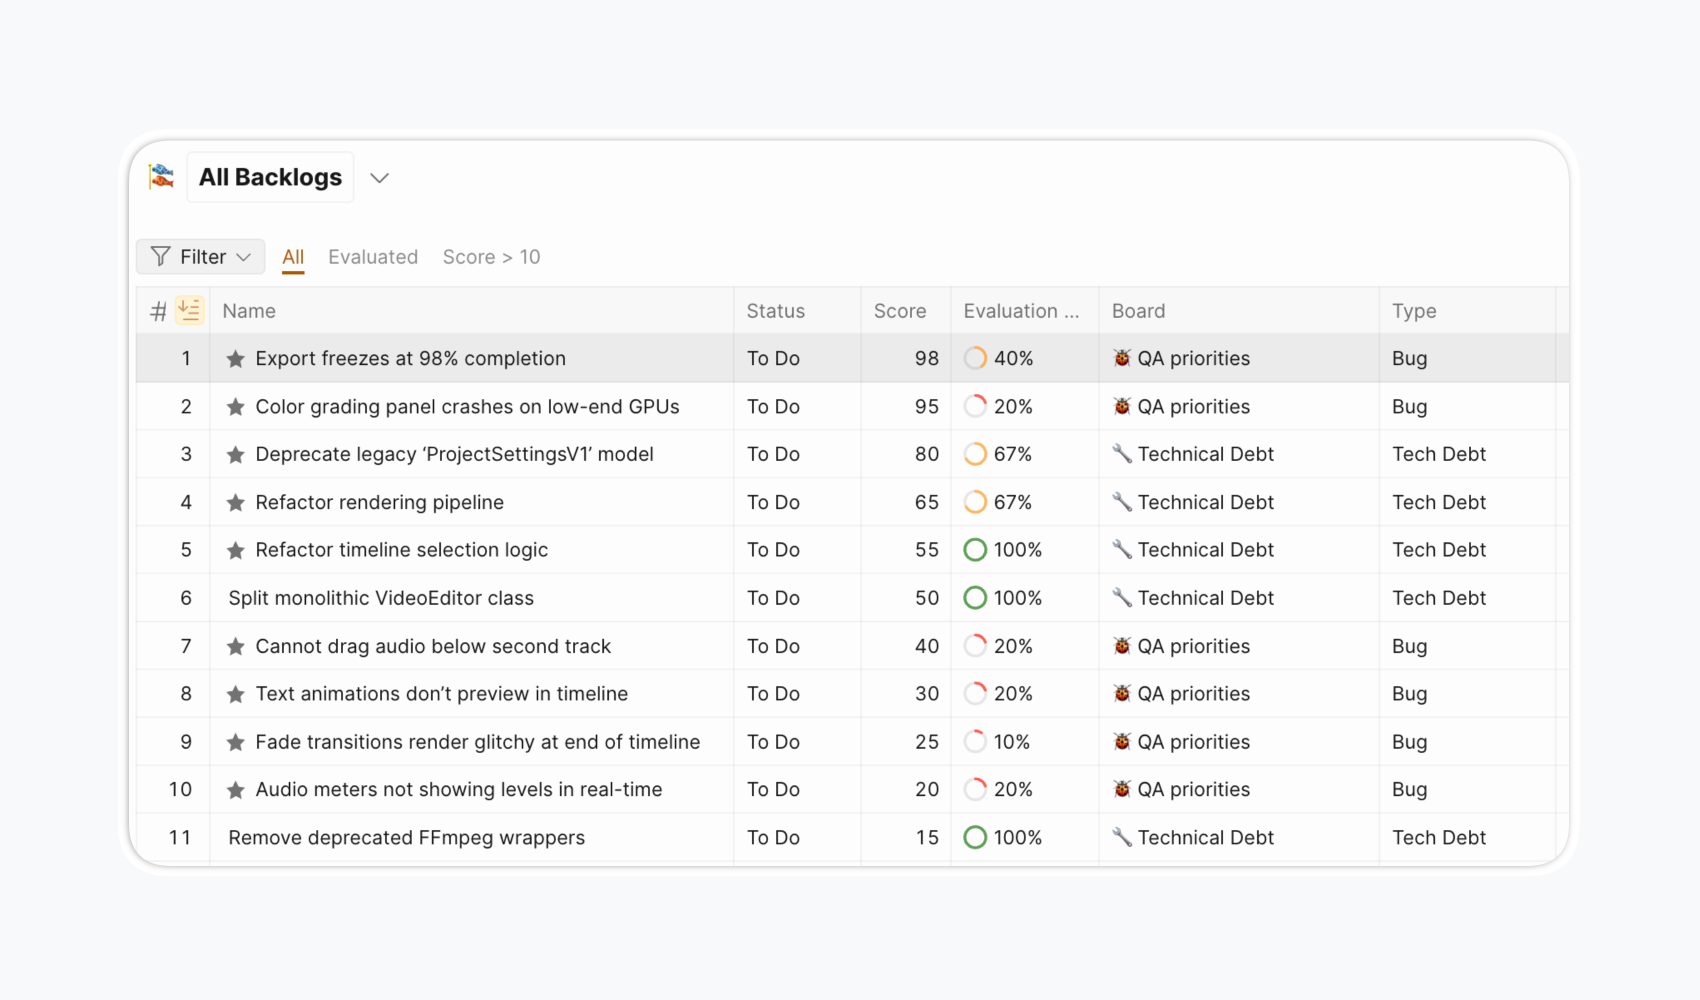
Step 1: Import your Backlog Issues
Add Issues to your prioritization Board to evaluate and rank them. Issues are the work items you need to prioritize—tasks, features, bugs, or initiatives. There are some import methods.
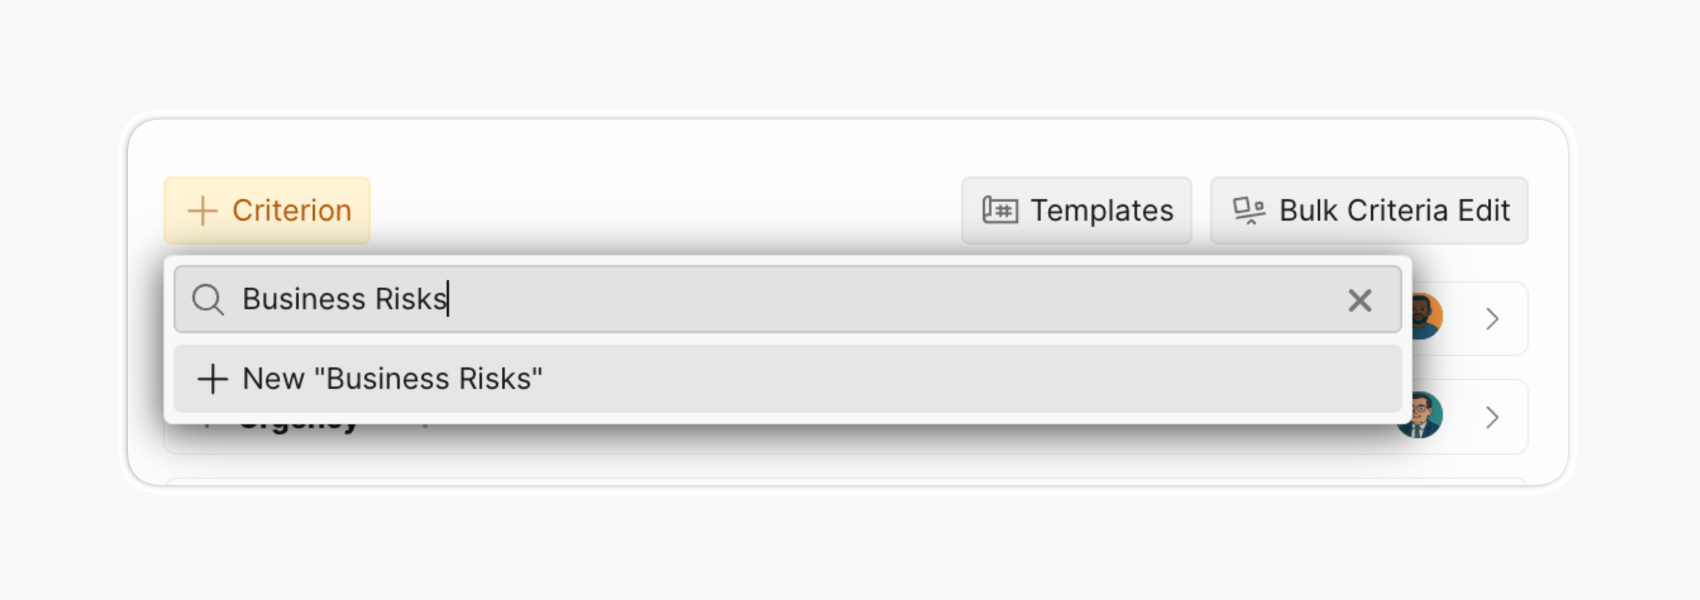
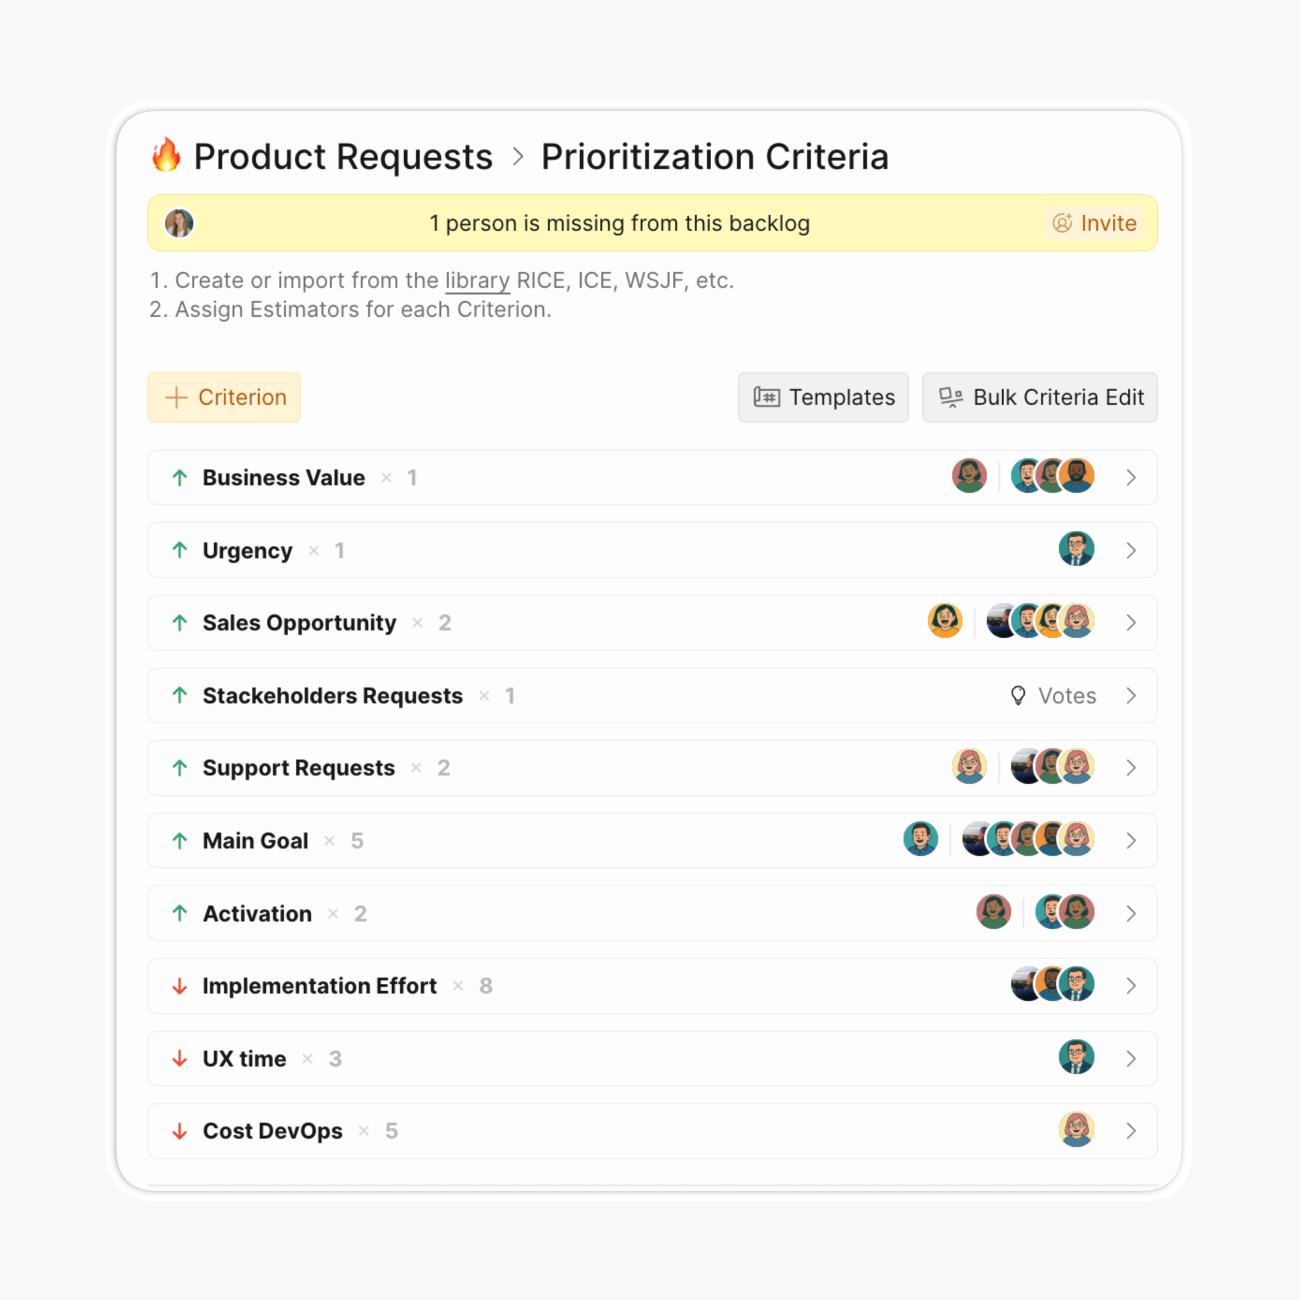
Step 2: Configure your criteria framework
Navigate to Criteria Settings and configure each criterion.
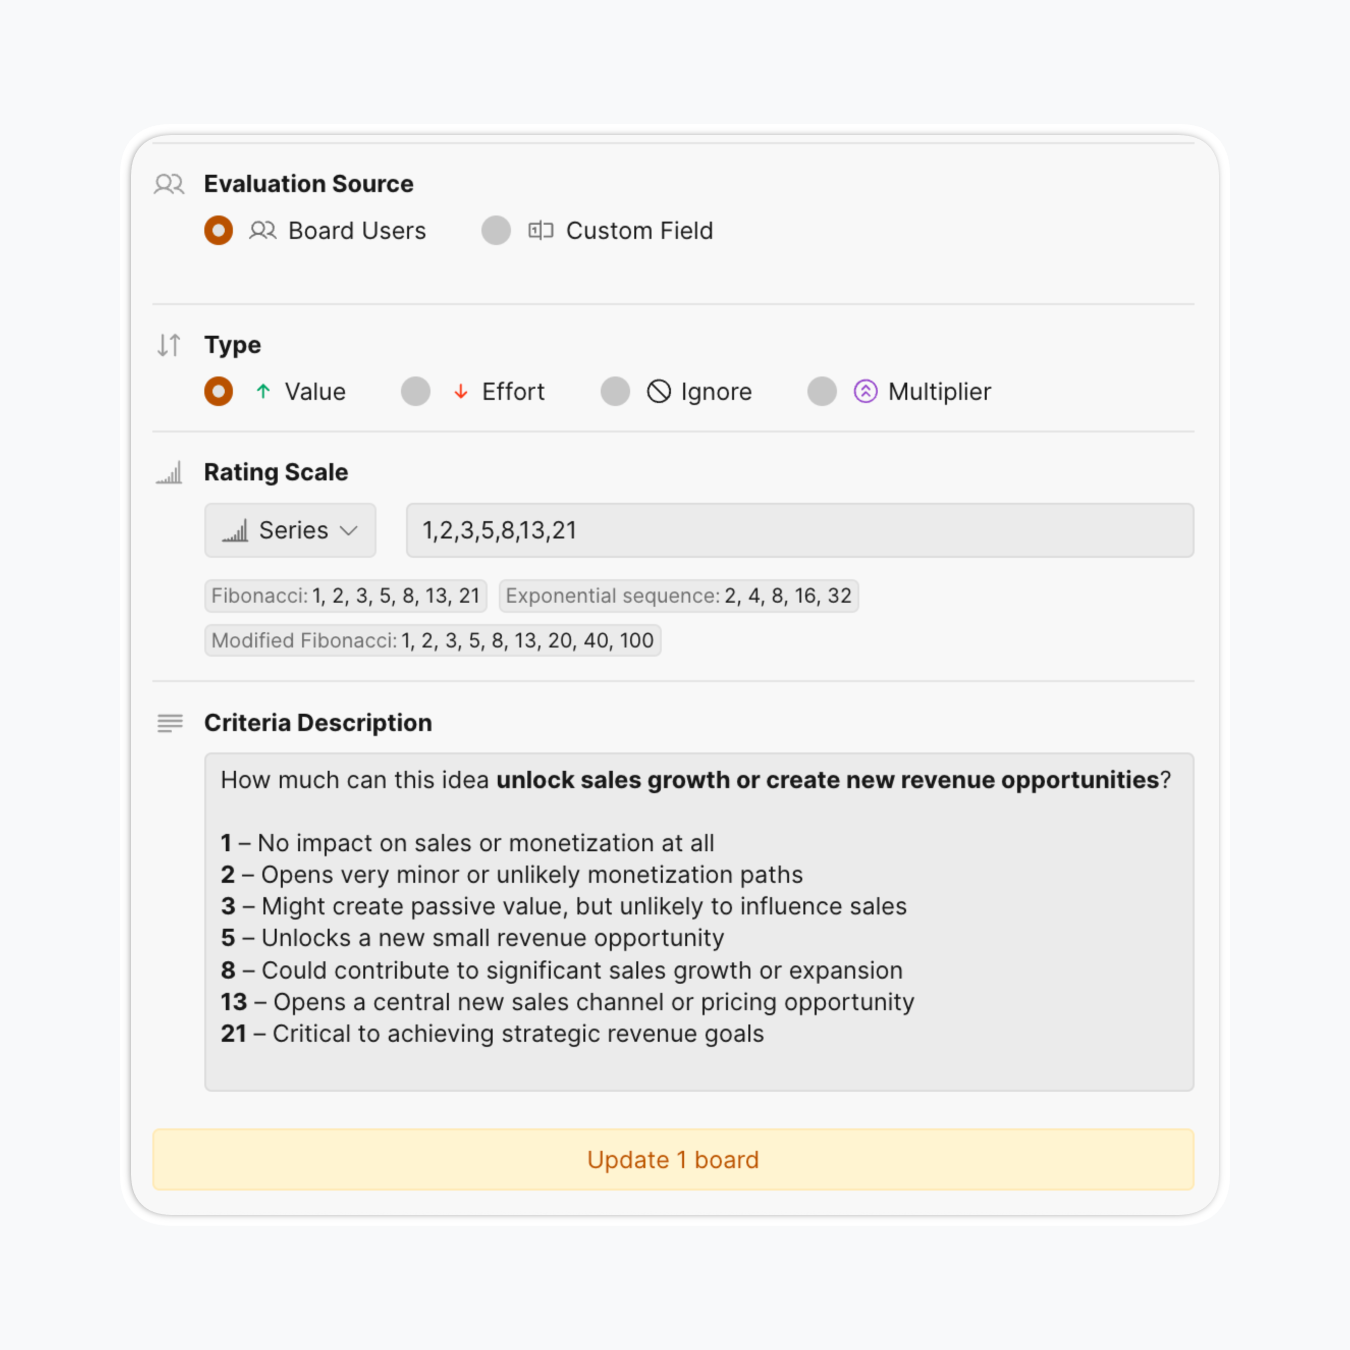
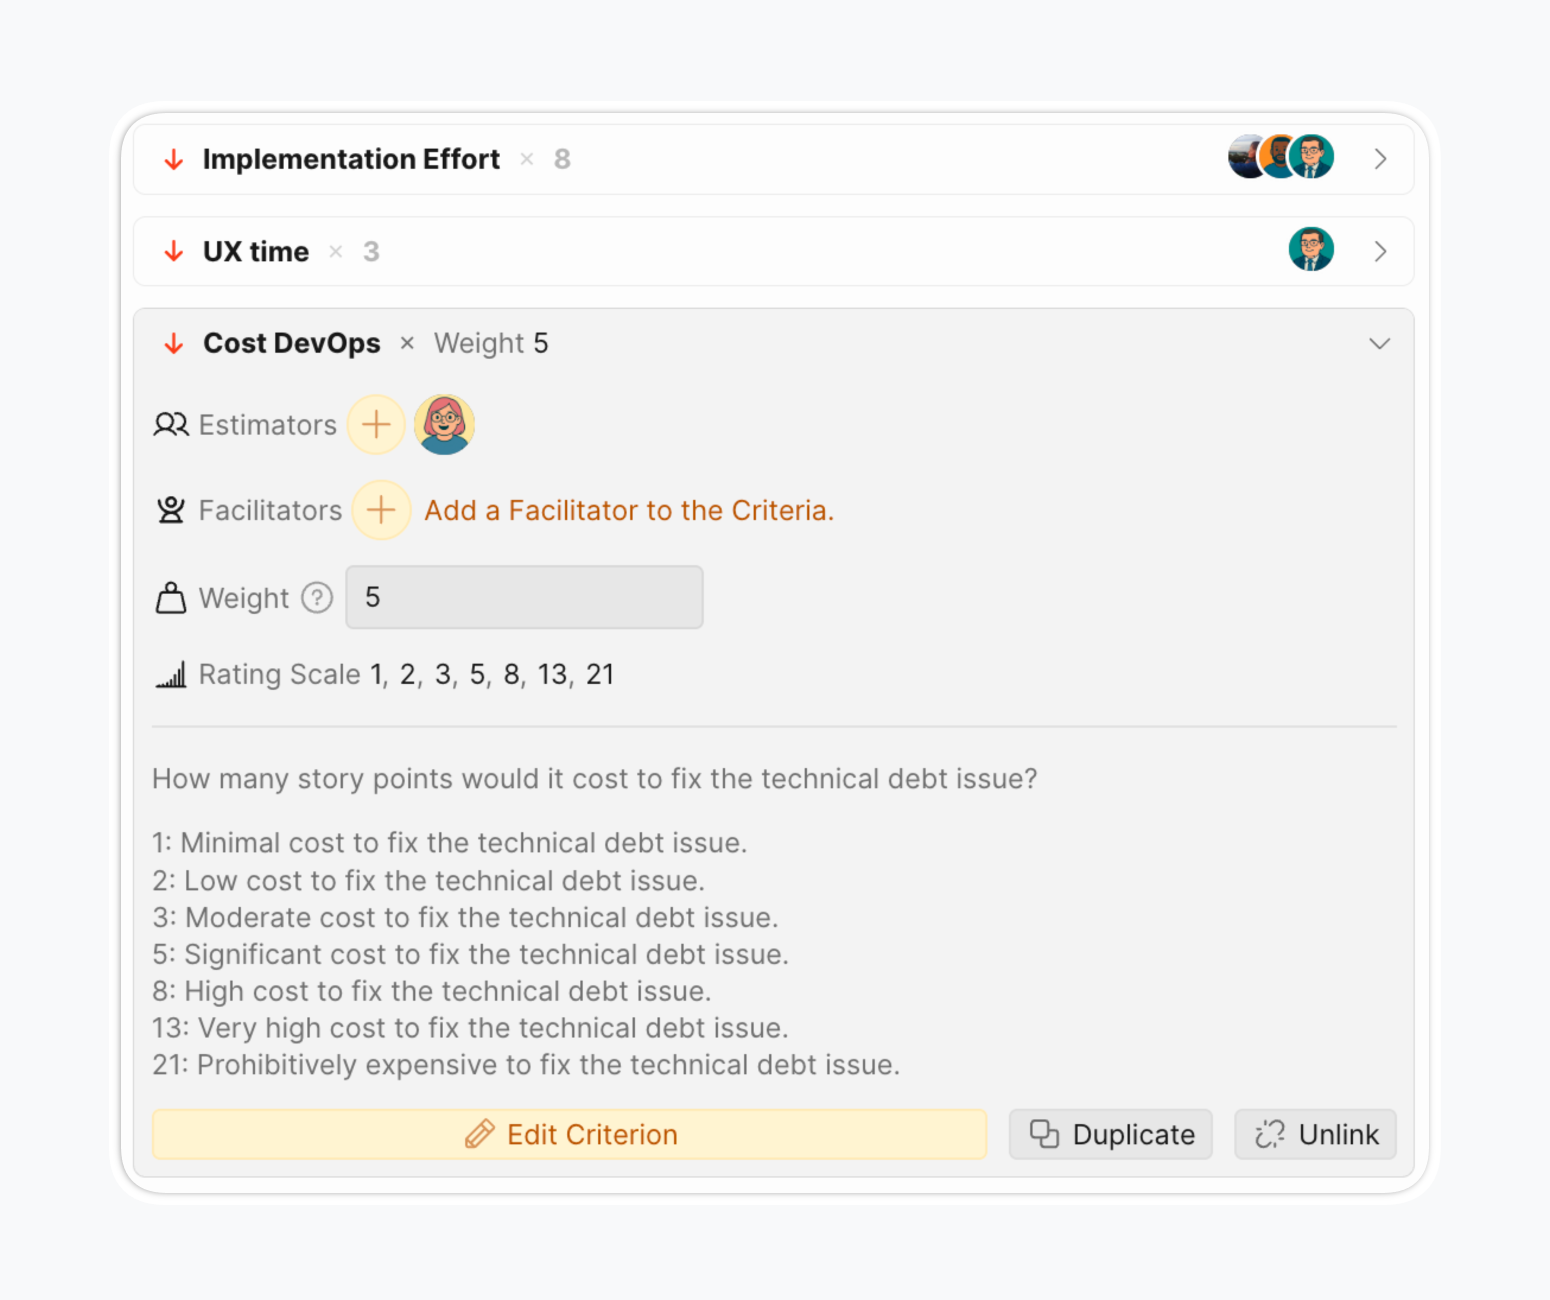
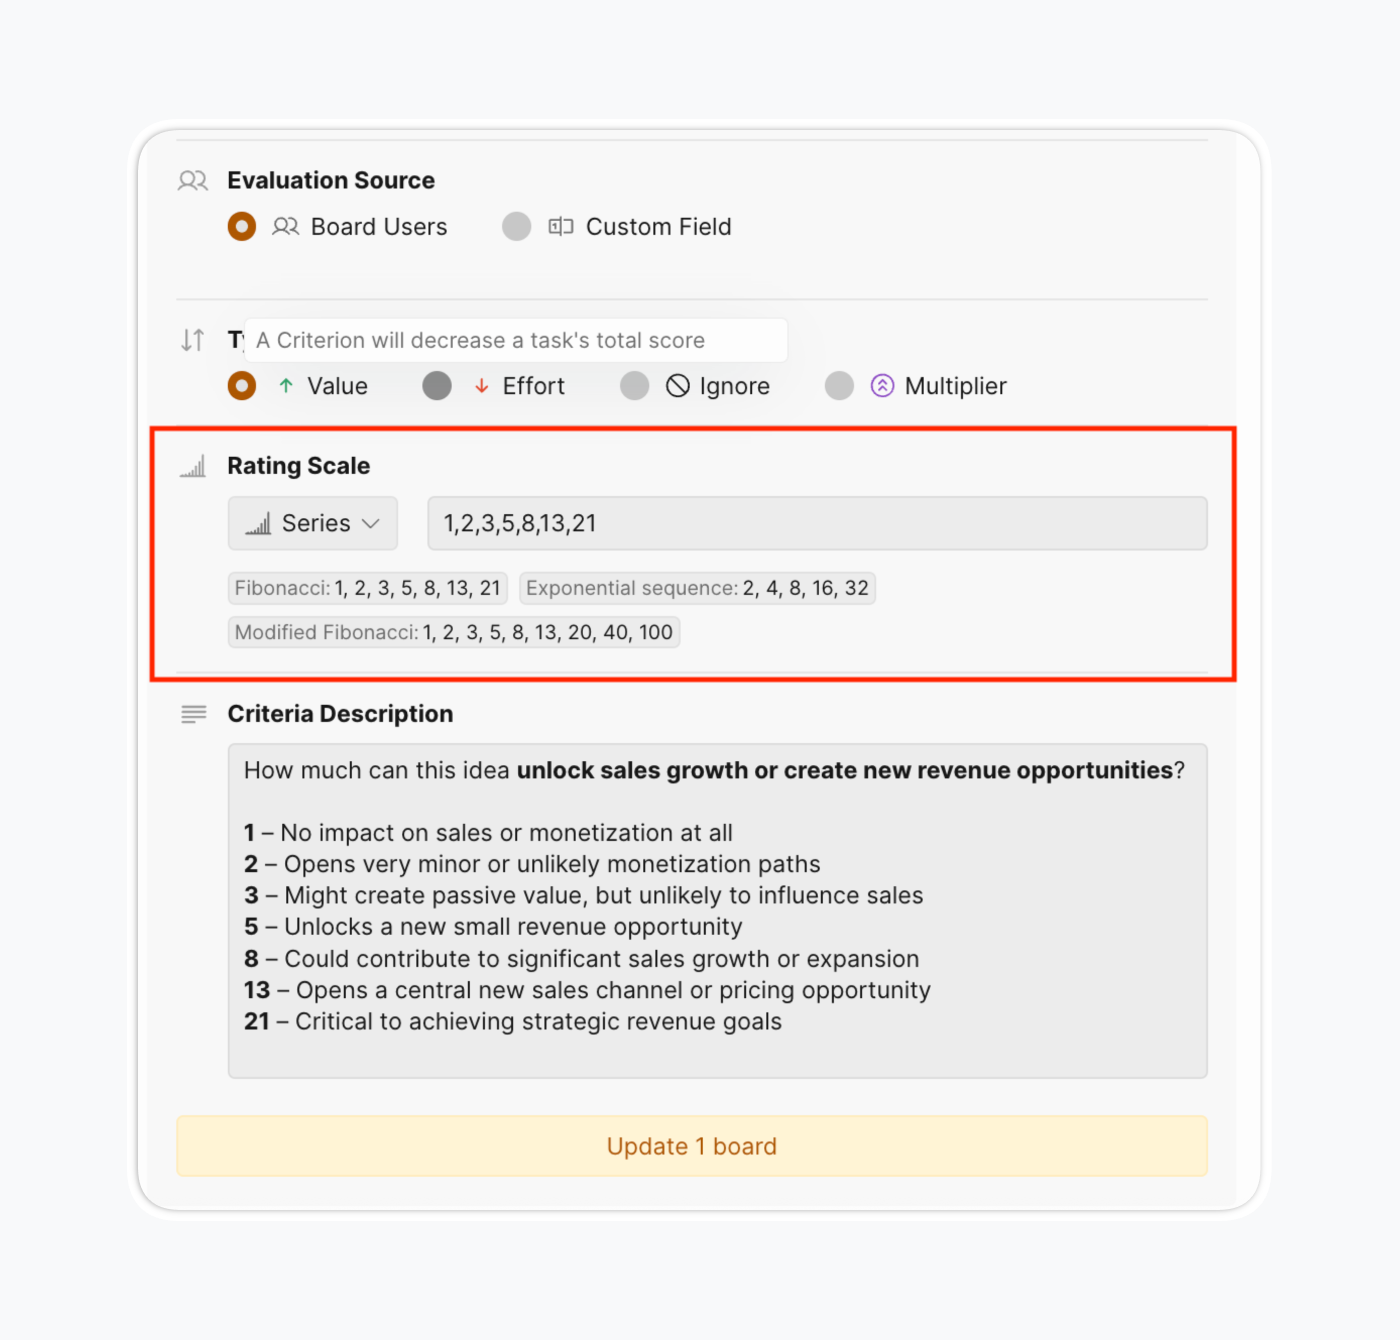
- Configure rating scale: Choose scoring methods—0-3, Fibonacci (0,1,2,3,5,8,13,21), geometric sequences, or custom
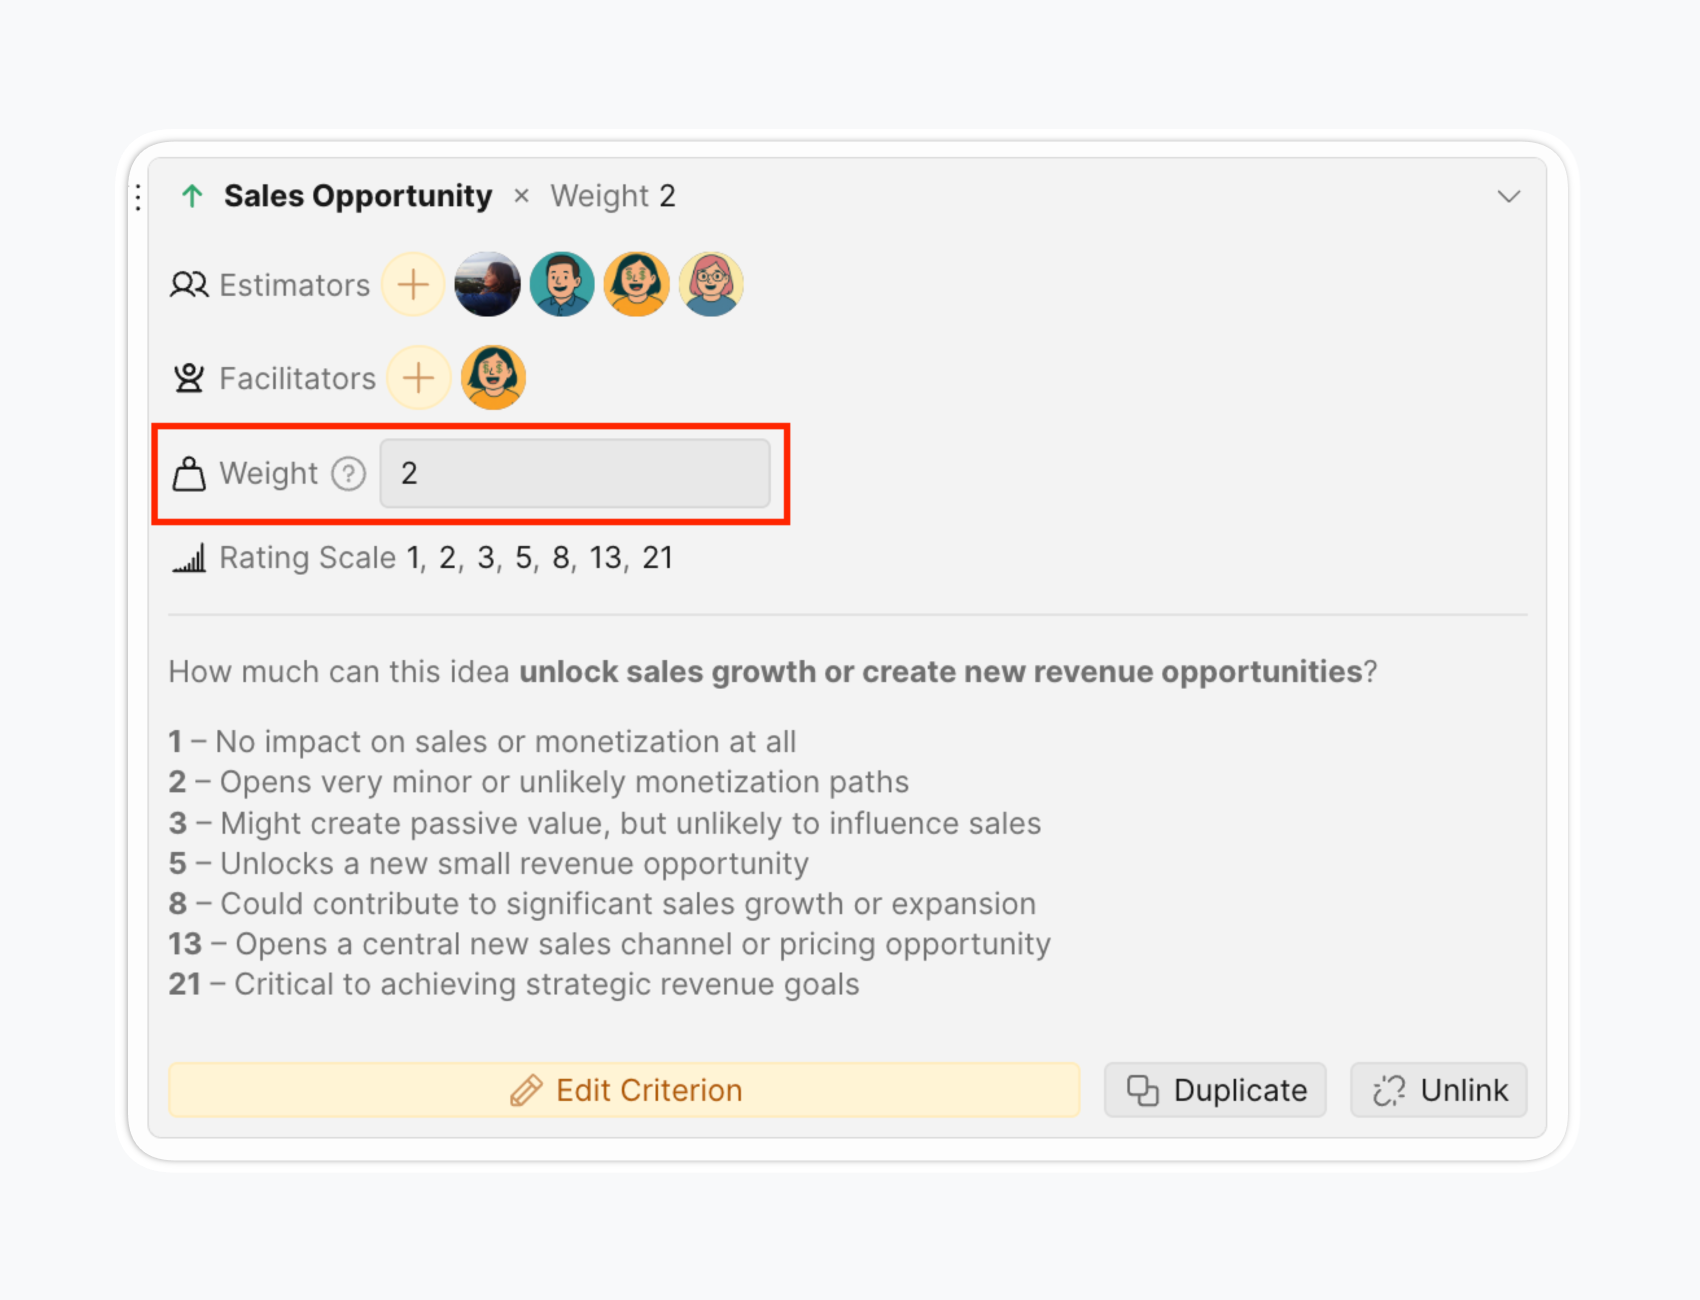
- Set criterion weight: Set the Weight to reflect how significant this Criterion is compared to others.
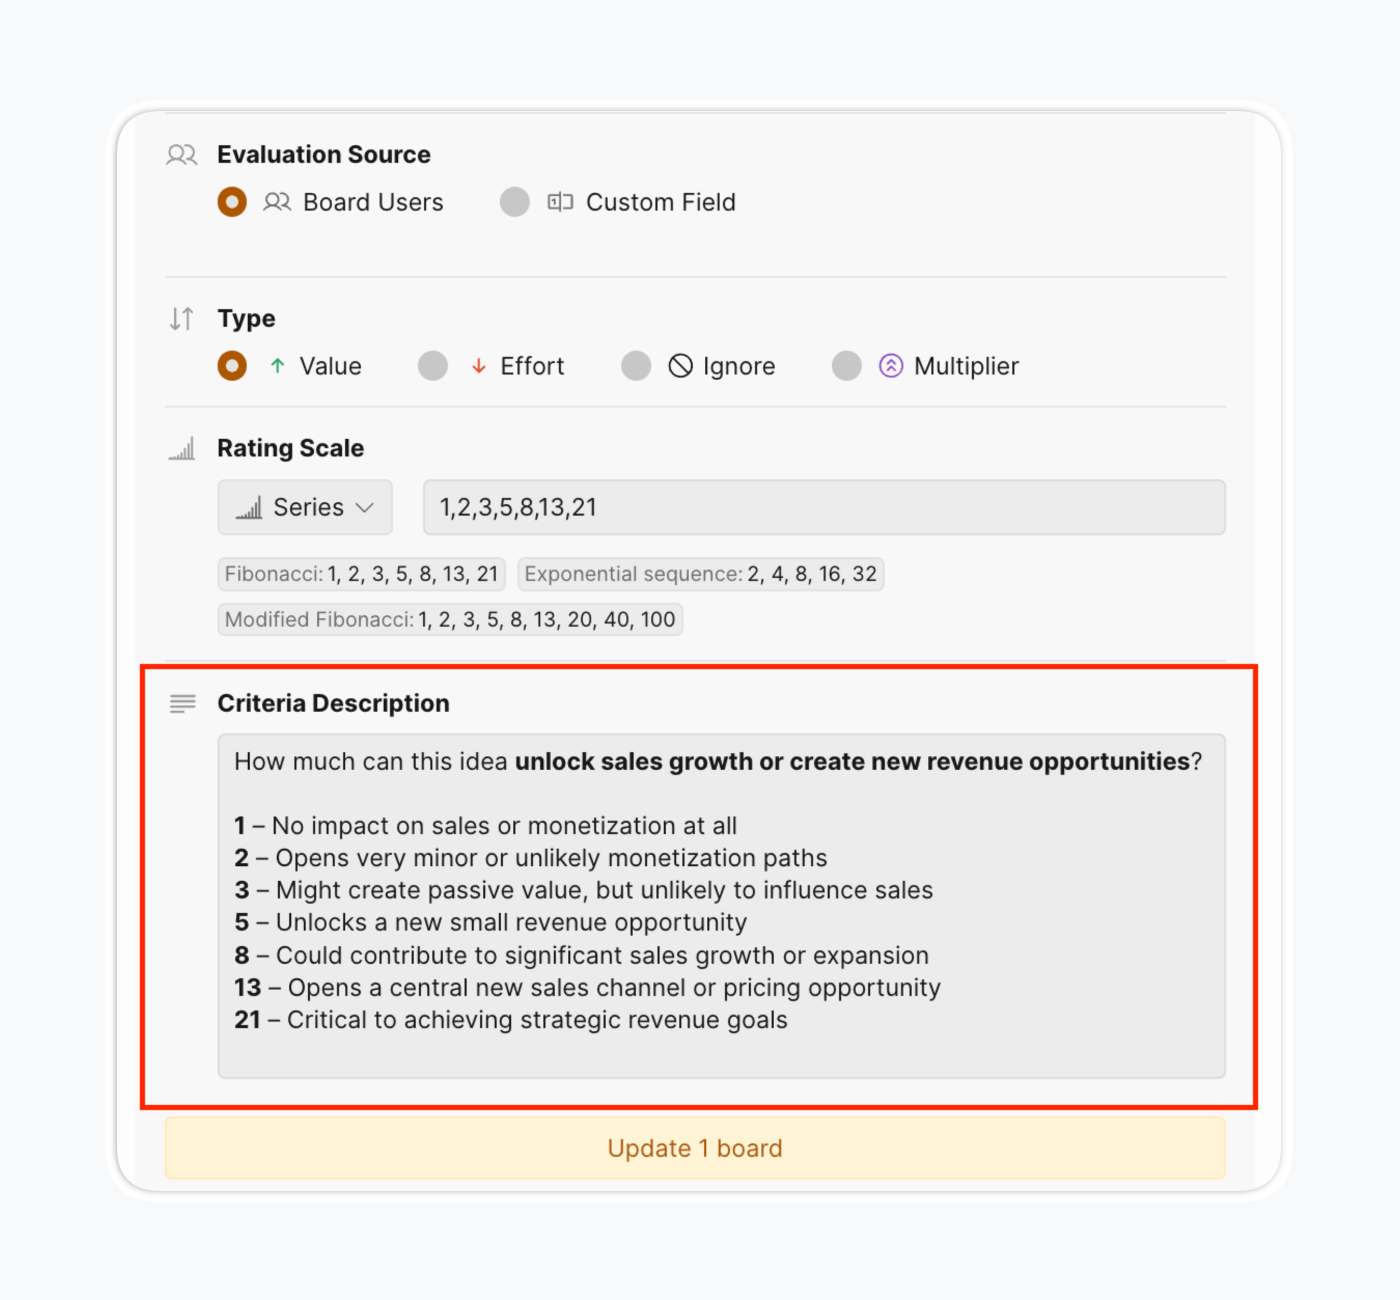
- Specify criteria descriptions: To build reliability faster and reduce subjectivity, add score meanings to criteria descriptions.
- Add custom factors for your objectives: You likely have multiple objectives, not just one metric to push. Value alone can't capture all business dimensions.
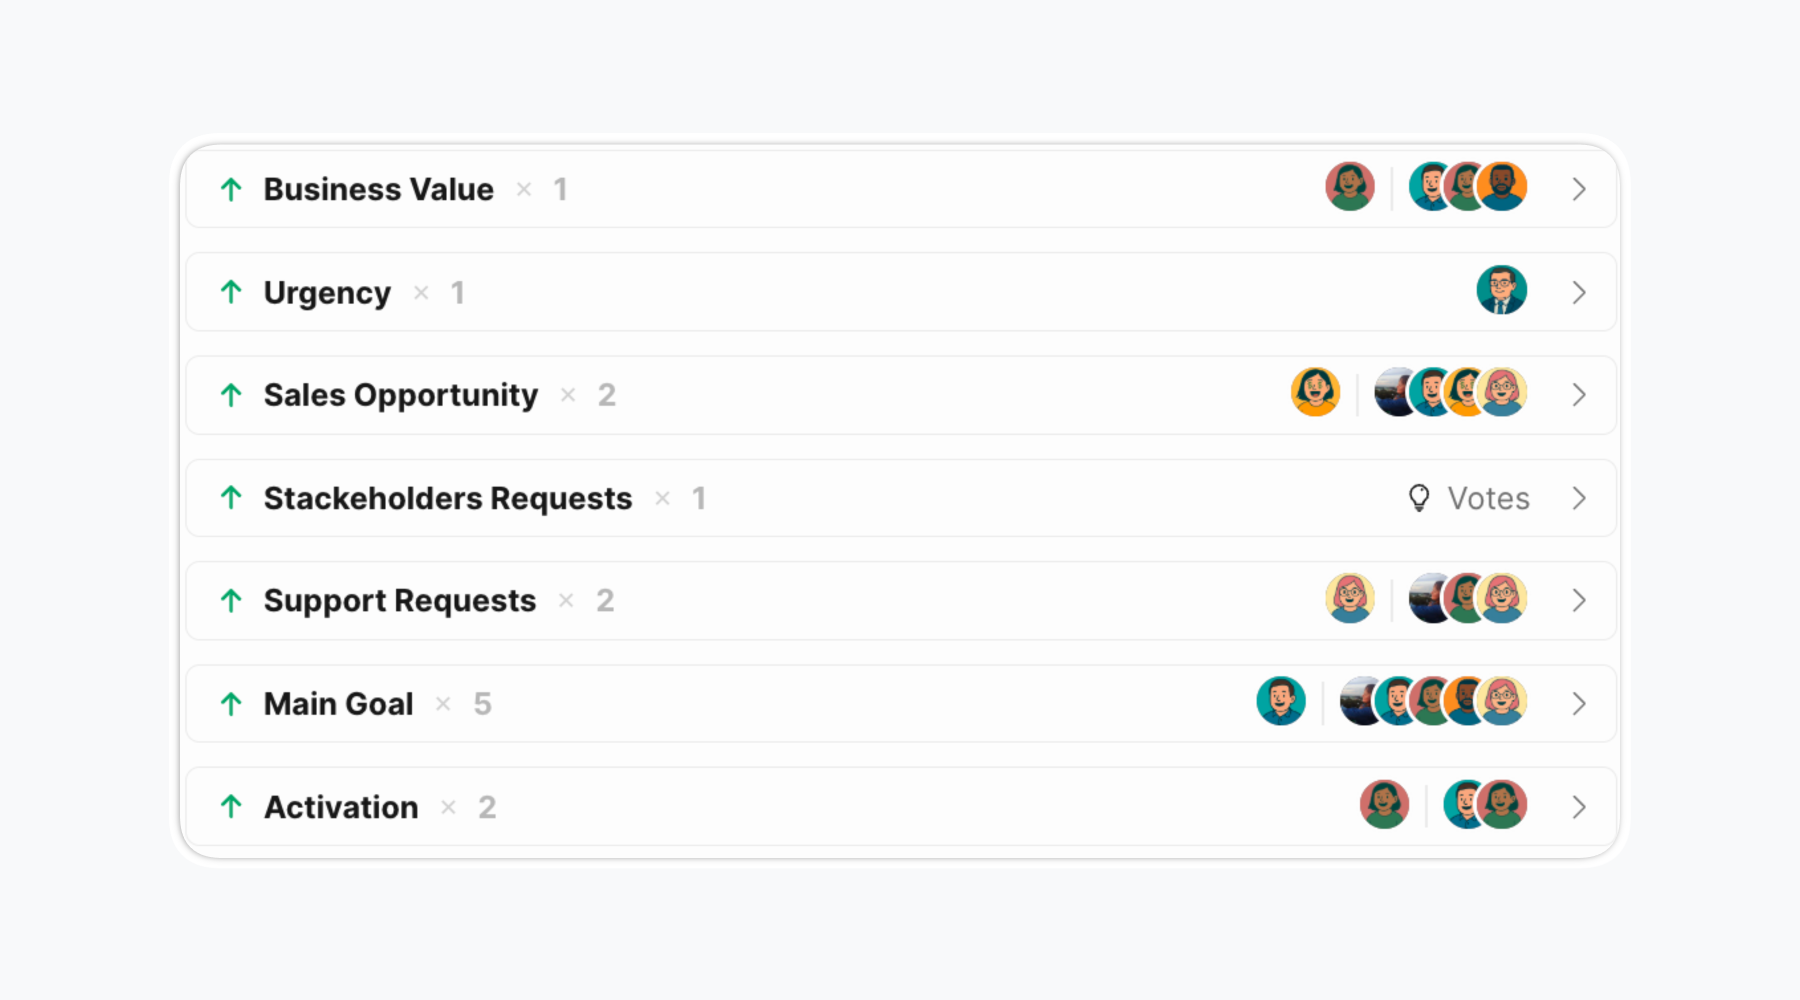
Step 3: Collect diverse opinions for expert assessment
Invite team members to the board and assign specific criteria to specific roles. This role-based assignment ensures qualified people score appropriate criteria. Divide criteria among team members according to their expertise. Evaluate some criteria collaboratively.
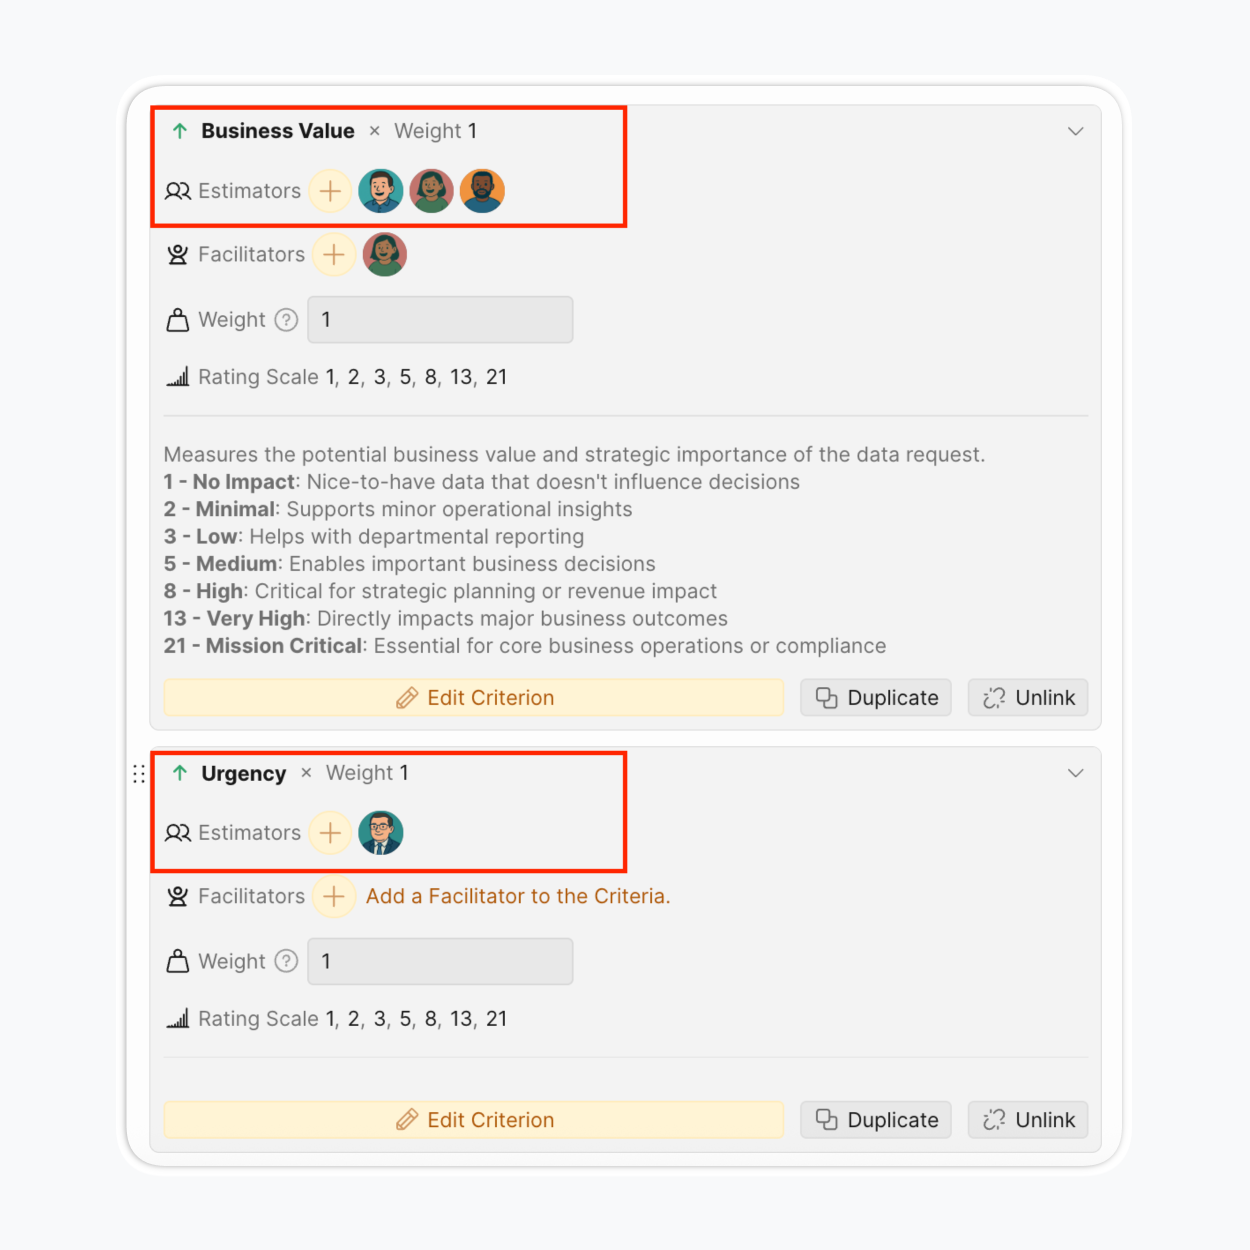
For example, the Activation criterion can be more clearly evaluated by product managers, analytics, and customer support.
While the implementation effort criterion is better evaluated by developers, designers, or analytics.
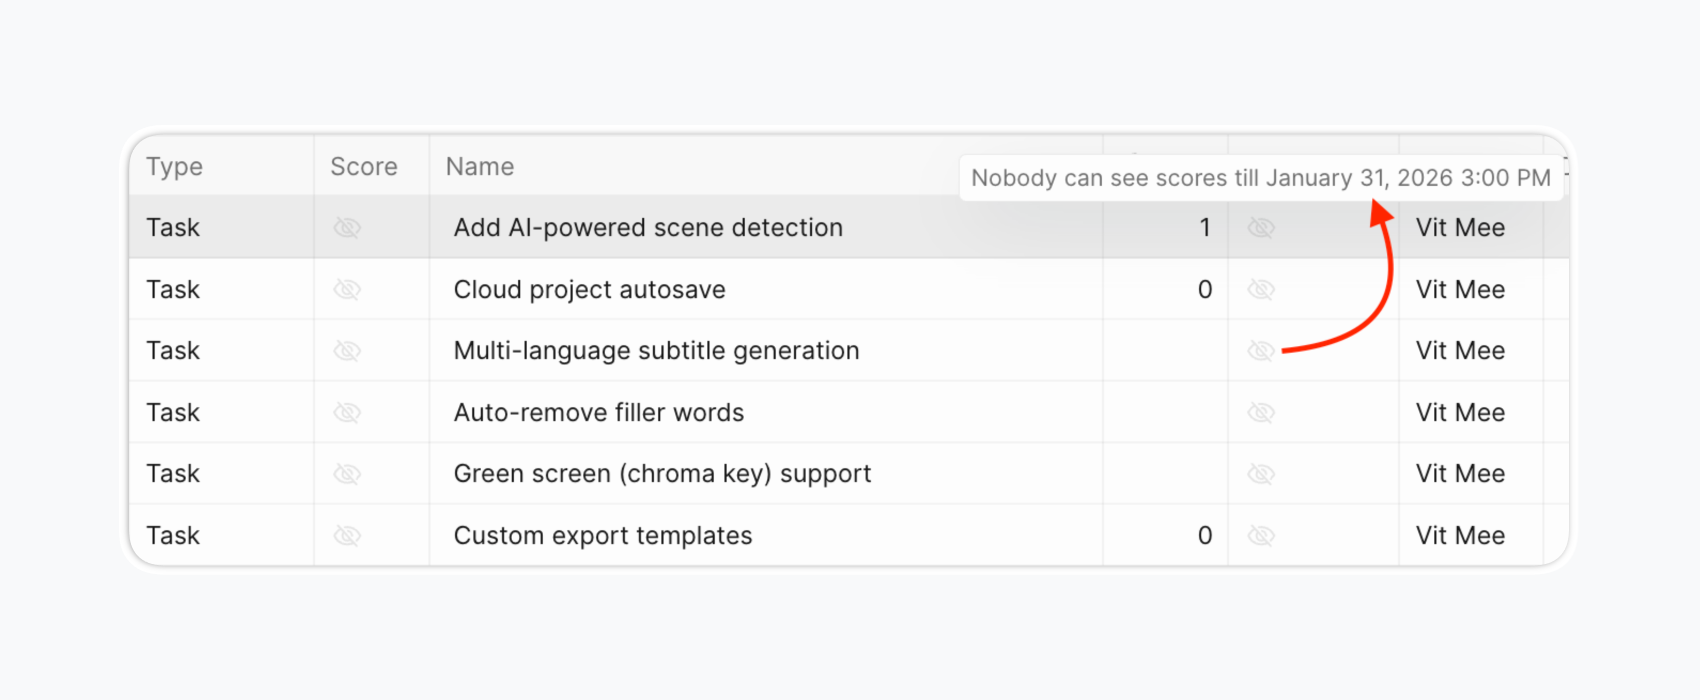
Step 4: Evaluate issues
Team members score backlog items against each assigned criterion. Use Evaluation Poker mode for unbiased scoring—team members evaluate independently with scores hidden until reveal date.
Step 5: Check score scatter for estimation clarity
After collaborative scoring, compare teammates' scores. You may discover someone:
Has a unique perspective other team members haven't considered Doesn't understand the project or the objective behind the criteria Sometimes all scores differ, indicating the team doesn't understand the project or criteria. This exercise reveals gaps in team alignment around goals. You need shared understanding—when building a rocket, you want a missile, not a flying saucer.
Discuss only projects or criteria with scattered scores to spot problems. No need to discuss the entire backlog together. This saves time on coordination work.
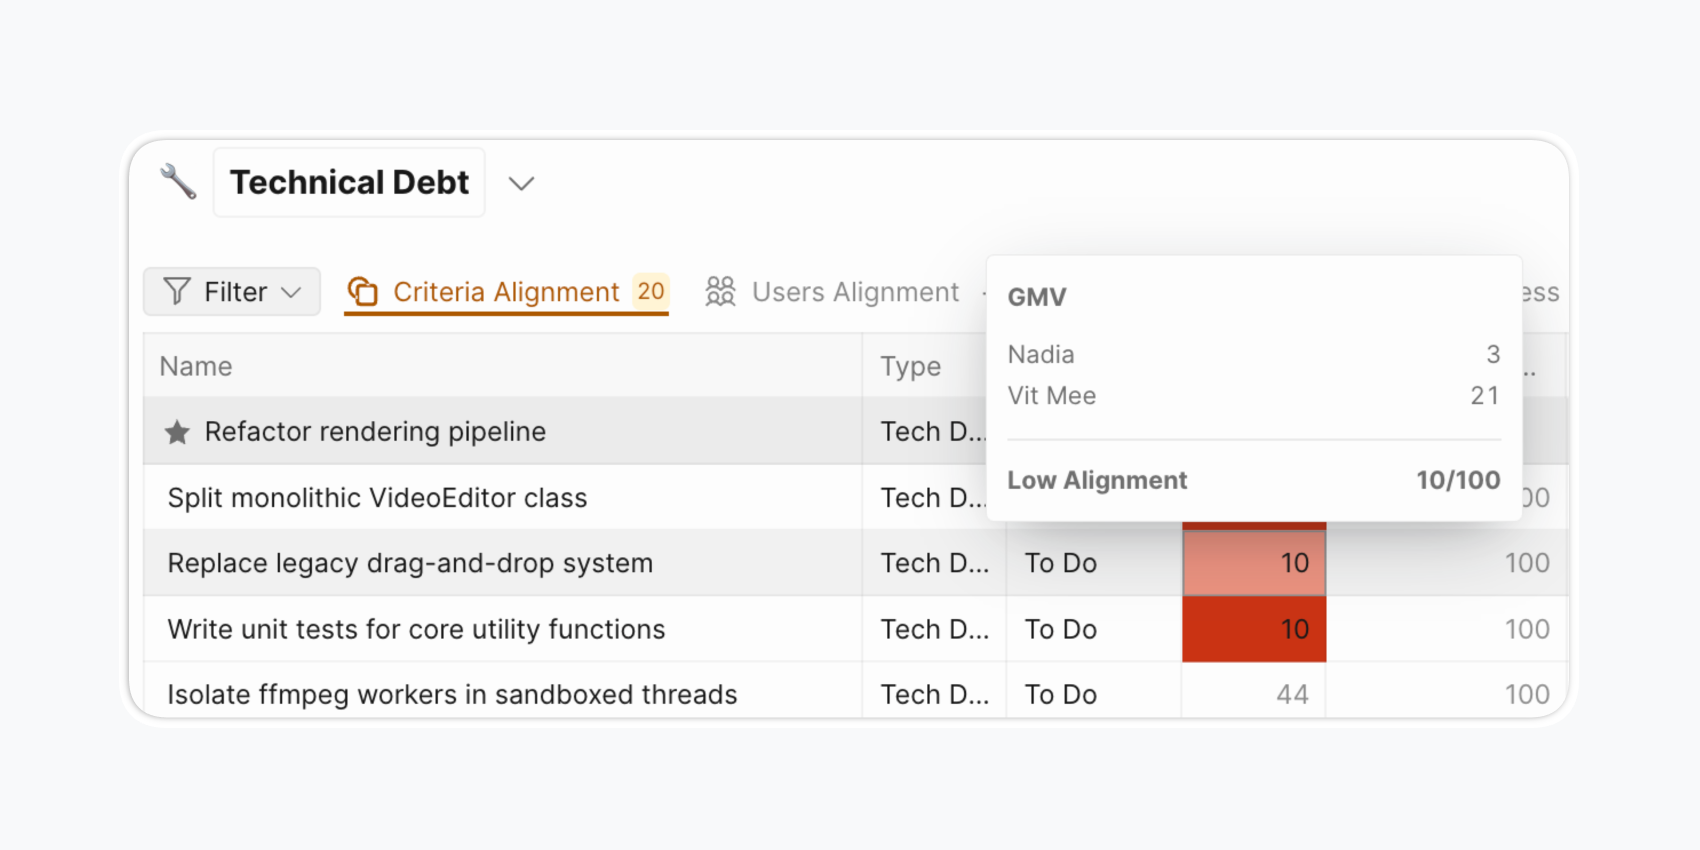
Use Alignment reports.
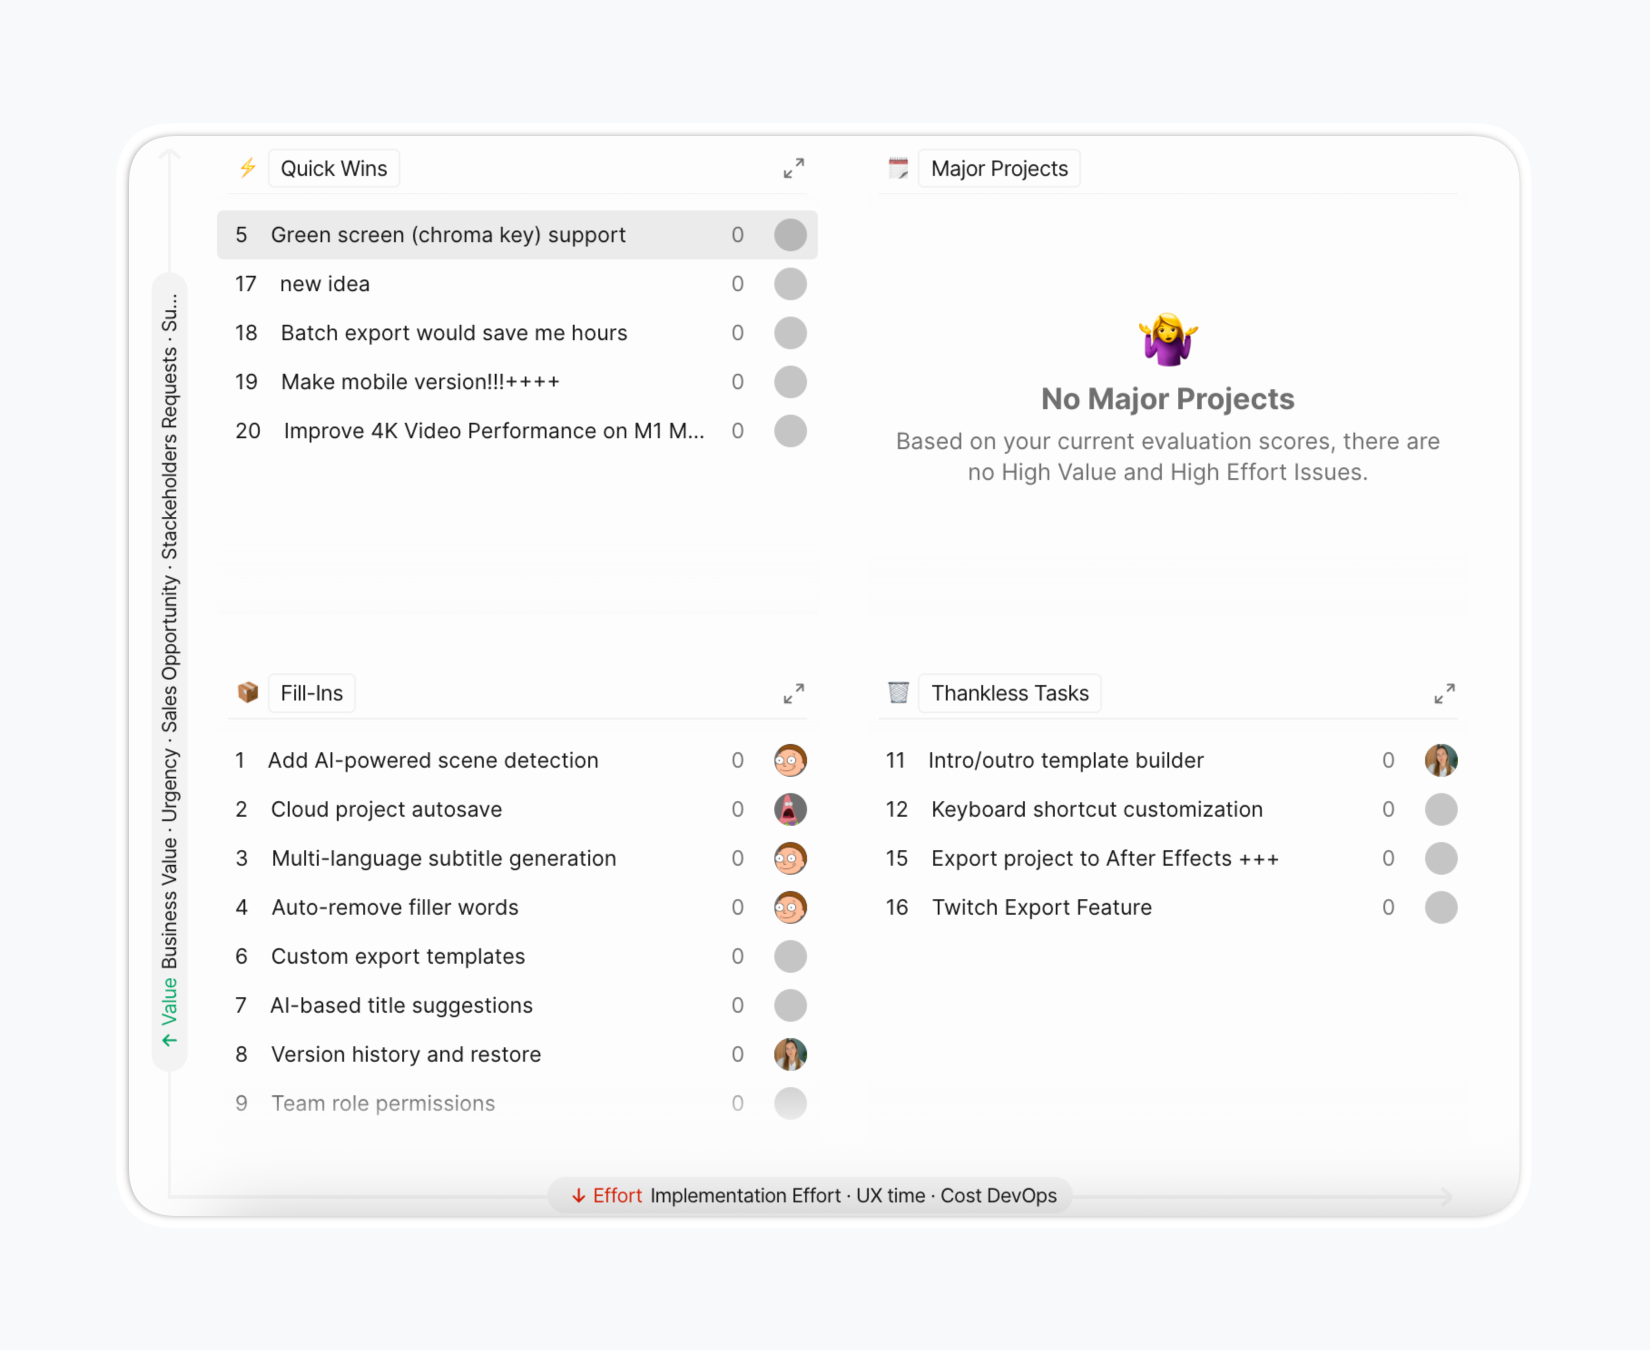
Step 6. Use matrix to visualize project influence
A 2×2 matrix helps visualize your product backlog when deciding what to develop next. Ranked lists are useful, but where do Quick Wins end and Major Projects begin? Distributing projects into four quadrants improves sprint planning by visually dividing the backlog into four categories based on speed and significance of results.
Step 7. Re-evaluate projects to update relevance
We once heard of a task that's been backlogged for nine years. Don't want to repeat the story? Re-evaluate your backlog regularly.
Priorities change quickly, sometimes overnight. A project may not reach the top initially but becomes valuable in a few sprints. If you don't want to lose great ideas at the bottom of your backlog, reassess them over time according to new circumstances.
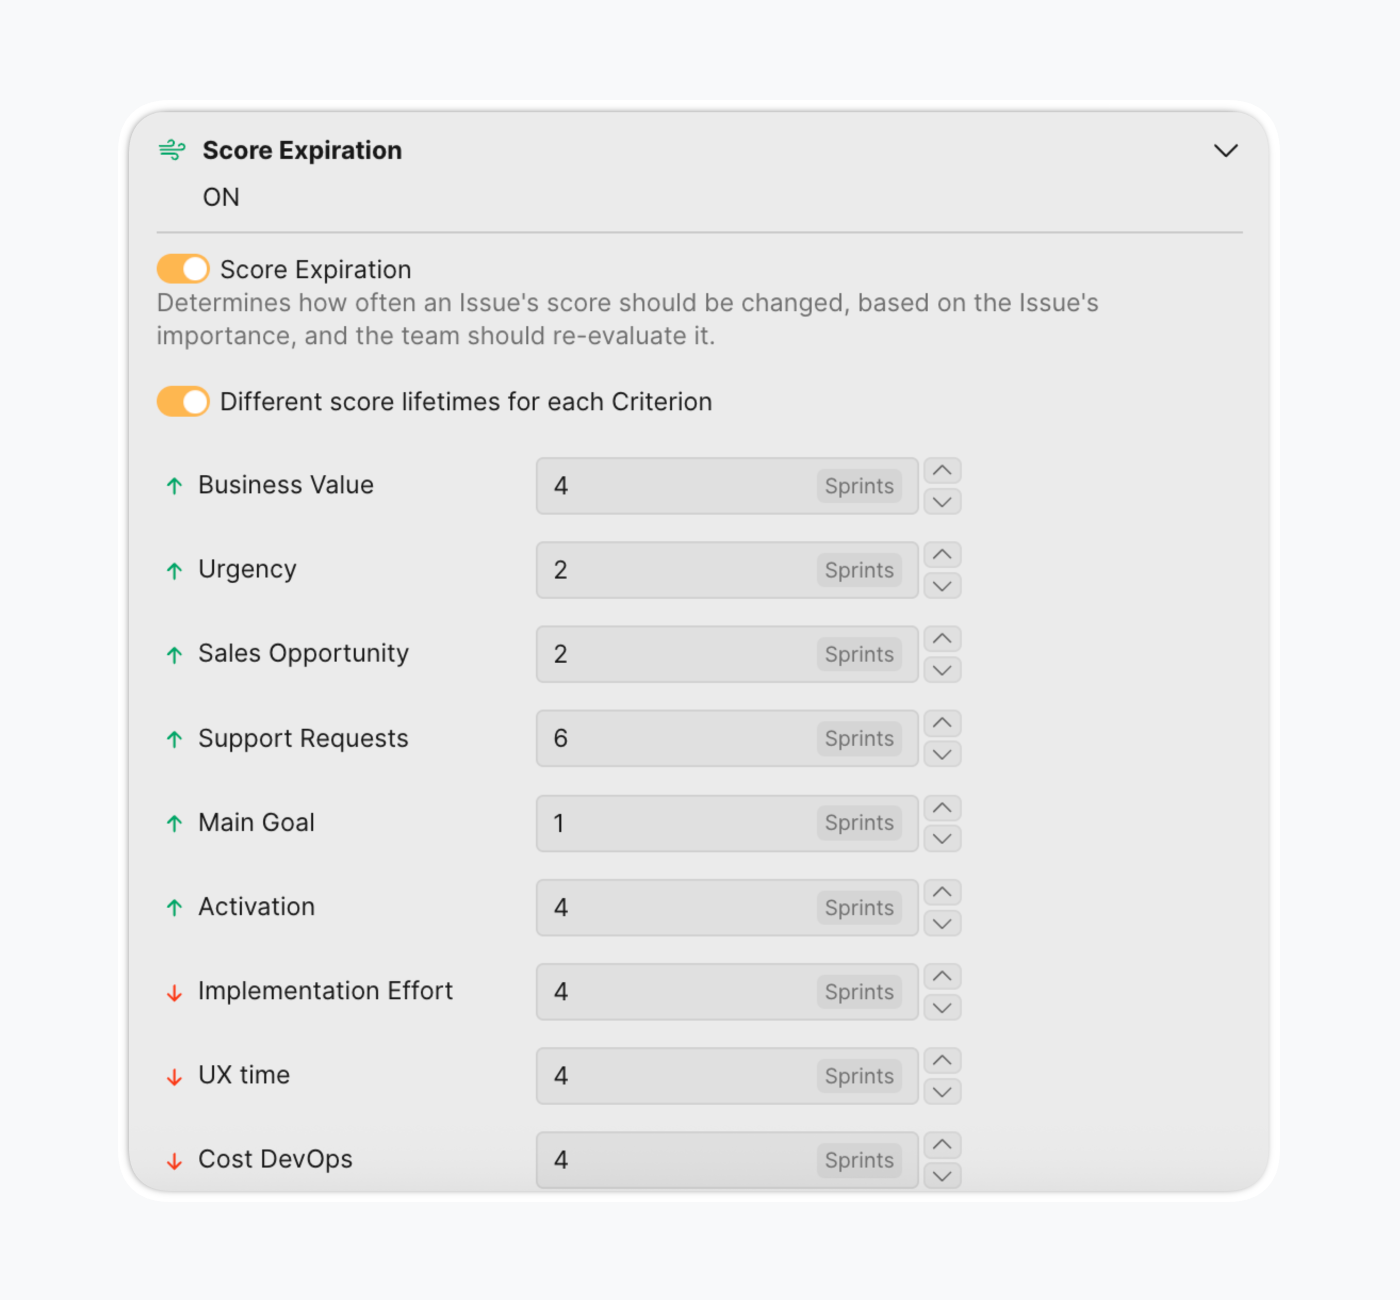
Learn more about Score Expiration.
Ducalis templates accelerate implementation
Ducalis provides multiple ready-to-use templates:
Impact-Effort Matrix Template: Basic 2-criteria setup (Impact + Effort) with 0-3 scoring. Ideal for teams new to prioritization frameworks.
Value vs Complexity/Effort Matrix Template: Uses High/Low Value and High/Low Complexity scoring, producing Quick Wins, Big Bets, Maybes, and Time Sinks quadrants.
RICE Template: Implements Reach, Impact, Confidence, Effort with the formula (R × I × C) / E for data-driven organizations needing numerical ranking.
WSJF Template: Implements Weighted Shortest Job First using Cost of Delay / Job Size with Fibonacci scoring for teams following SAFe methodology.
Additional templates include HEART UX Prioritization, AARRR (pirate metrics), Eisenhower Matrix, Technical Debt Prioritization, and ICE Framework.
Important distinction: The Matrix page uses non-weighted calculations for quadrant distribution (pure Value vs Effort positioning), while the Top Priorities page uses weighted calculations for ranking. This allows visual quadrant analysis to remain intuitive while detailed rankings incorporate sophistication.
Matrix visualization offers multiple views
List View
Issues grouped by quadrant with expandable sections. Items ordered by priority within each quadrant. Quick scanning of quadrant membership and relative priority.
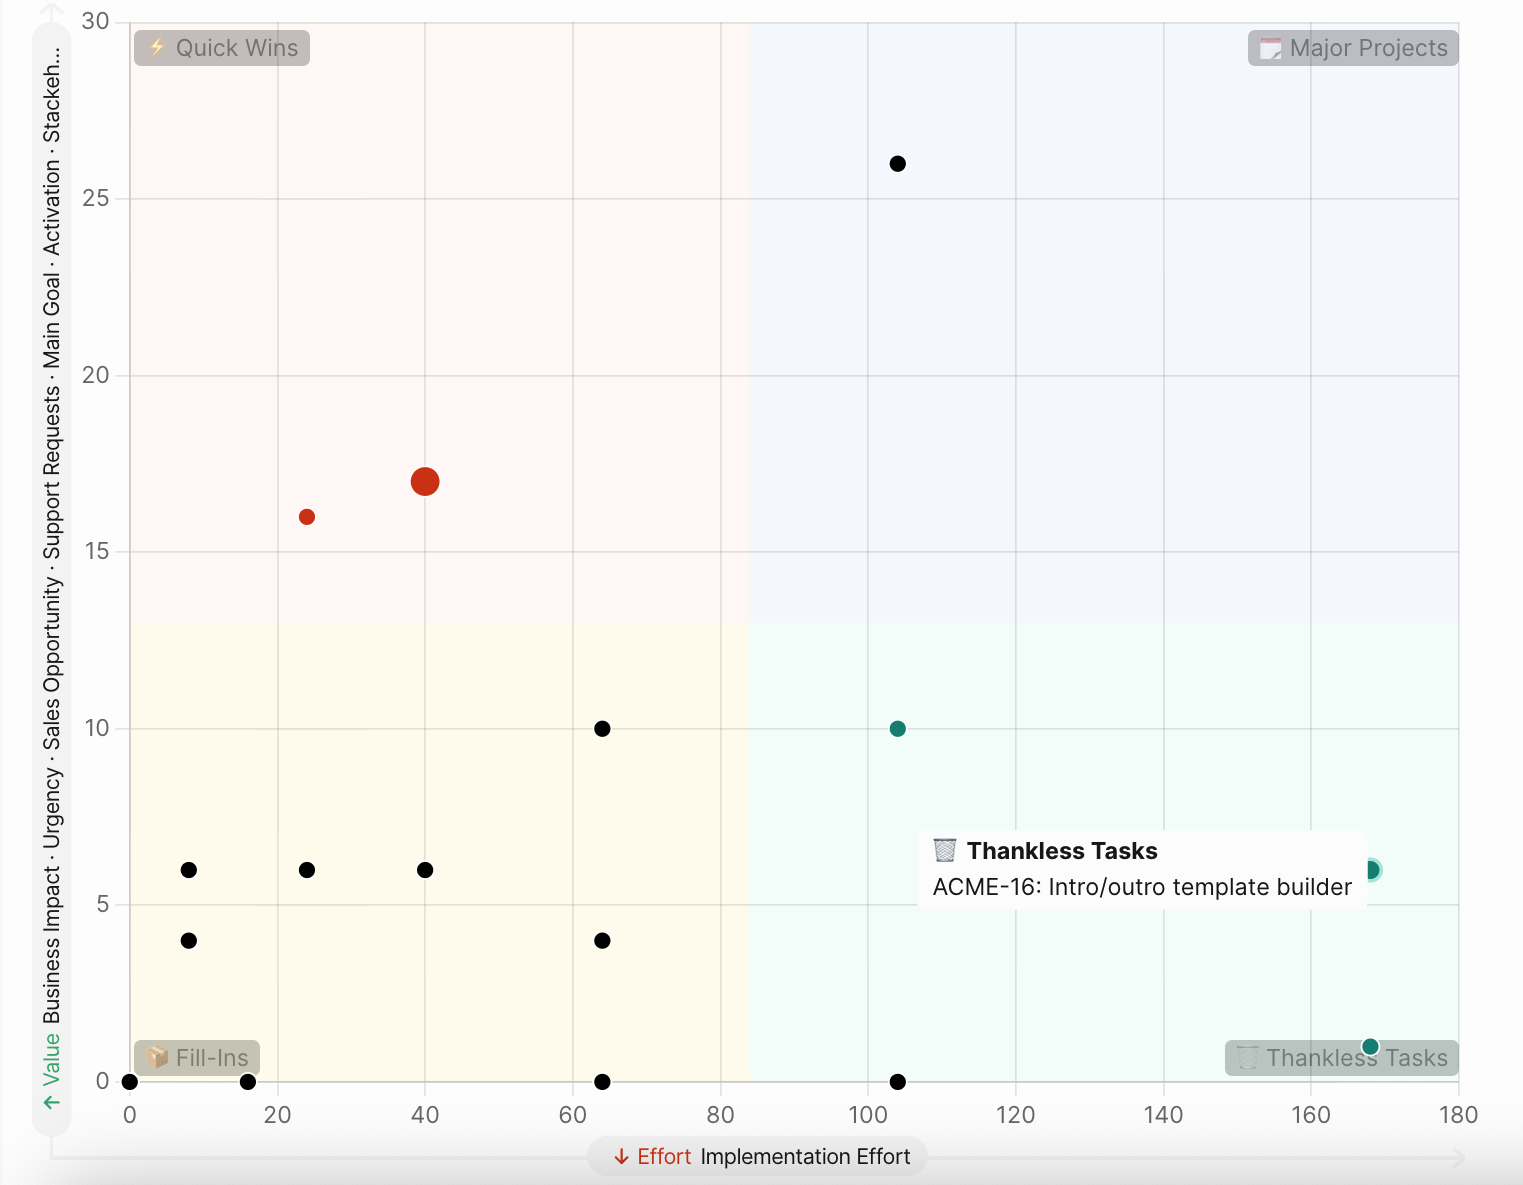
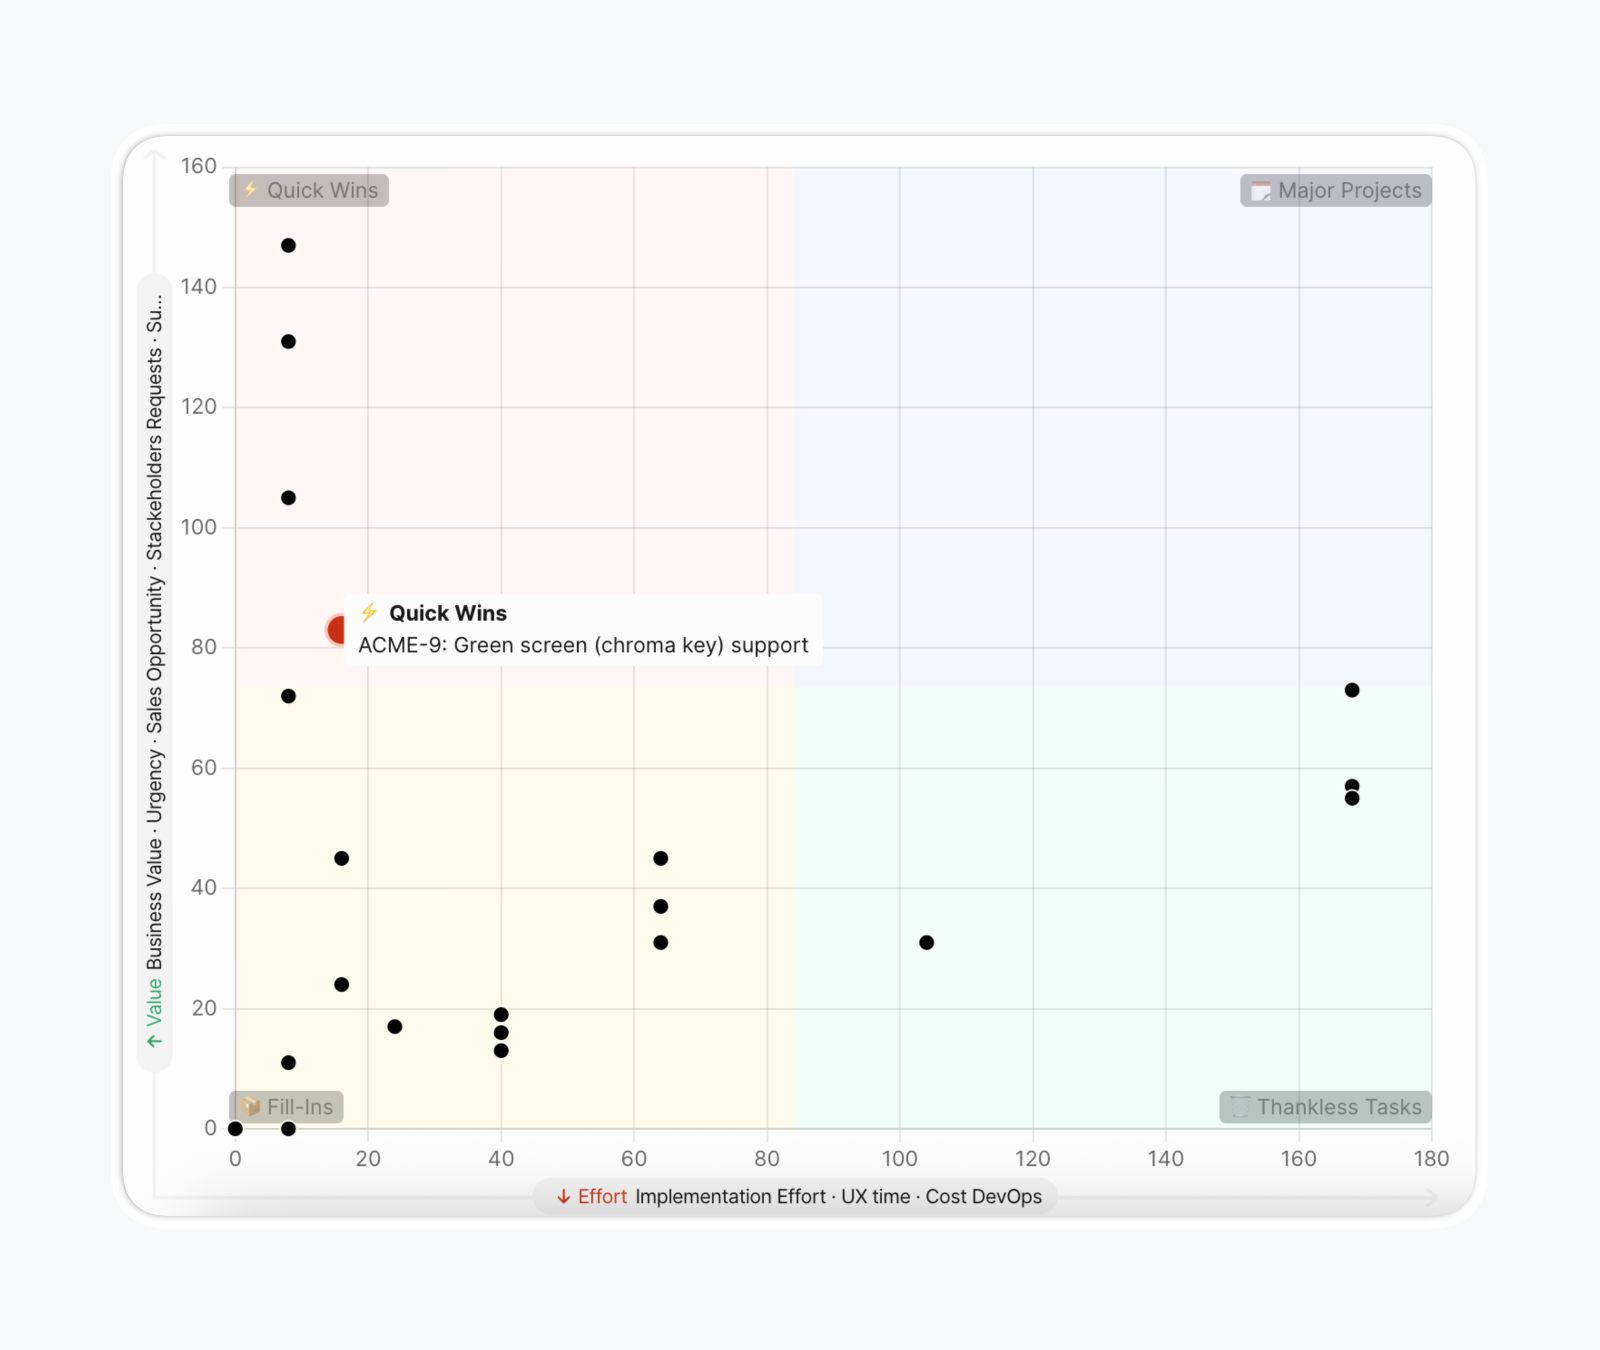
Bubble View
Issues displayed as color-coded bubbles positioned on X-Y grid based on Value/Effort scores. Hover for issue summary tooltip; click to open full issue card. Visual clustering reveals patterns.
Dynamic criteria filtering enables toggling criteria on/off at the top of the matrix. Enabling or disabling criteria recalculates and redistributes issues dynamically—useful for sprint-specific prioritization focus or "what-if" analysis.
Quadrant customization: Quadrant names and emojis are fully customizable to match organizational terminology preferences.
Unique Ducalis capabilities extend basic prioritization
Beyond the standard 2x2 matrix, Ducalis offers several distinguishing features:
Multi-criteria frameworks: Add unlimited value criteria (Revenue, Activation, Retention, etc.) and multiple effort criteria (Dev Time, UX Complexity, etc.) combining into sophisticated weighted scoring.
Aggregated Report Boards: Combine multiple boards for end-to-end visibility across teams and projects. Zoom in/out of project contexts while maintaining portfolio perspective.
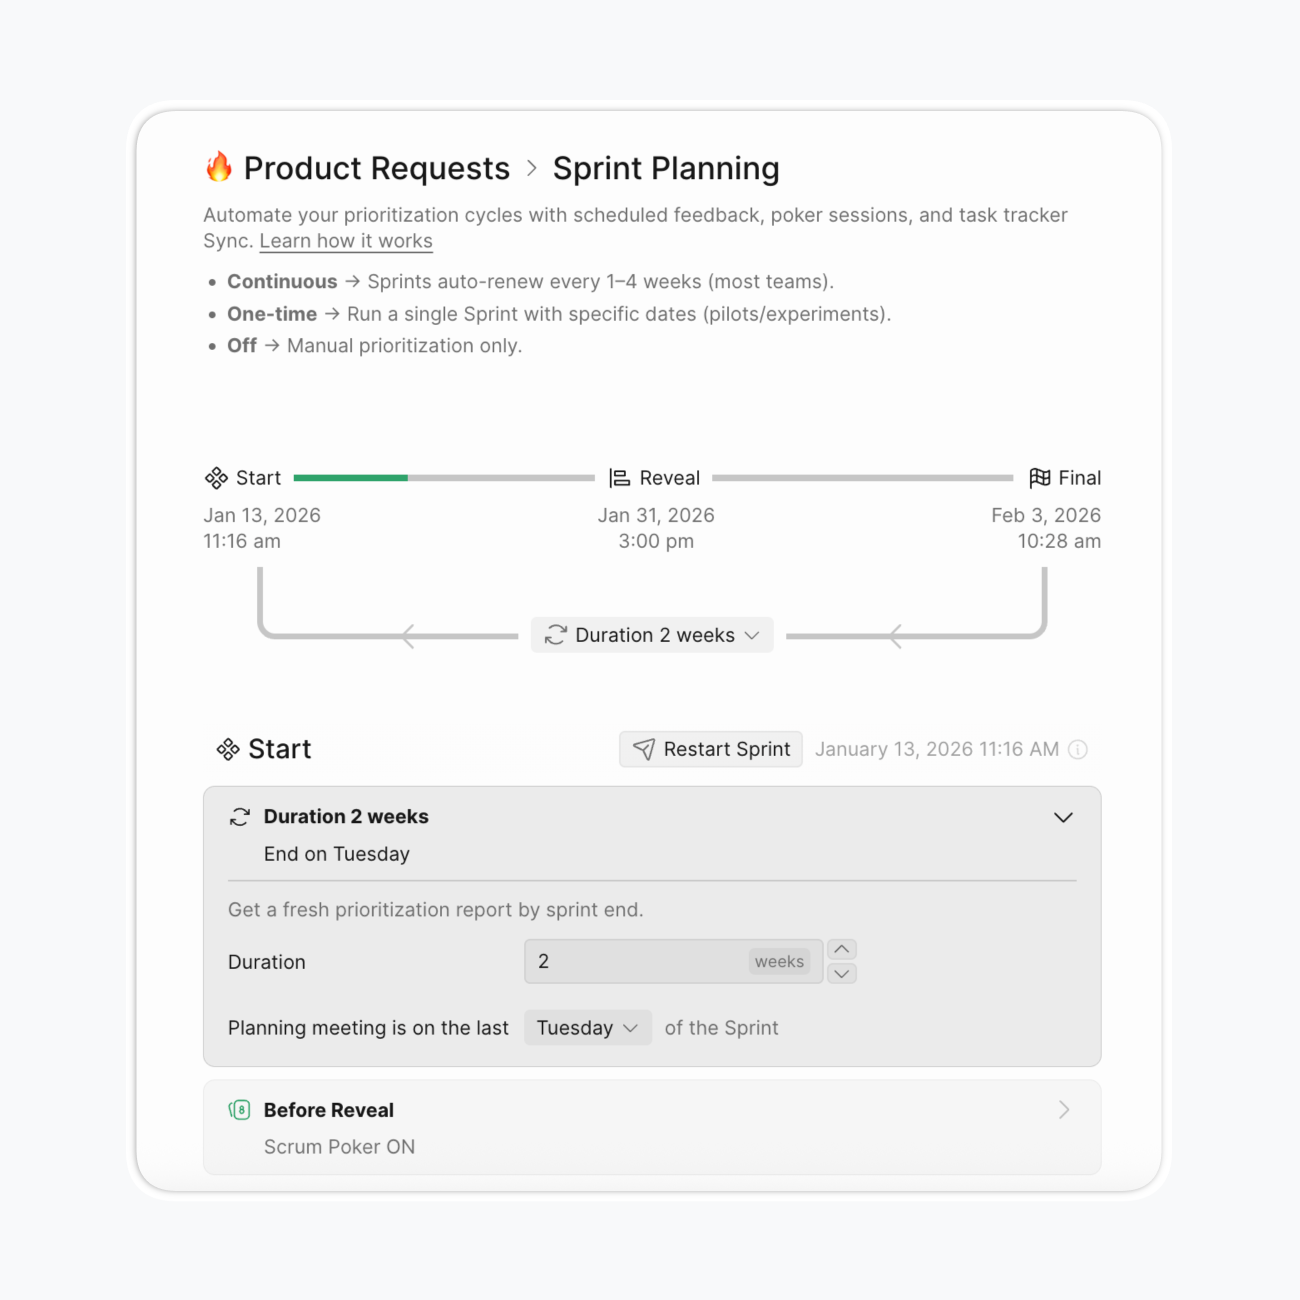
Sprint planning integration: Set sprint duration and evaluation cycles, configure score expiration settings, and receive automatic reminders for re-evaluation.
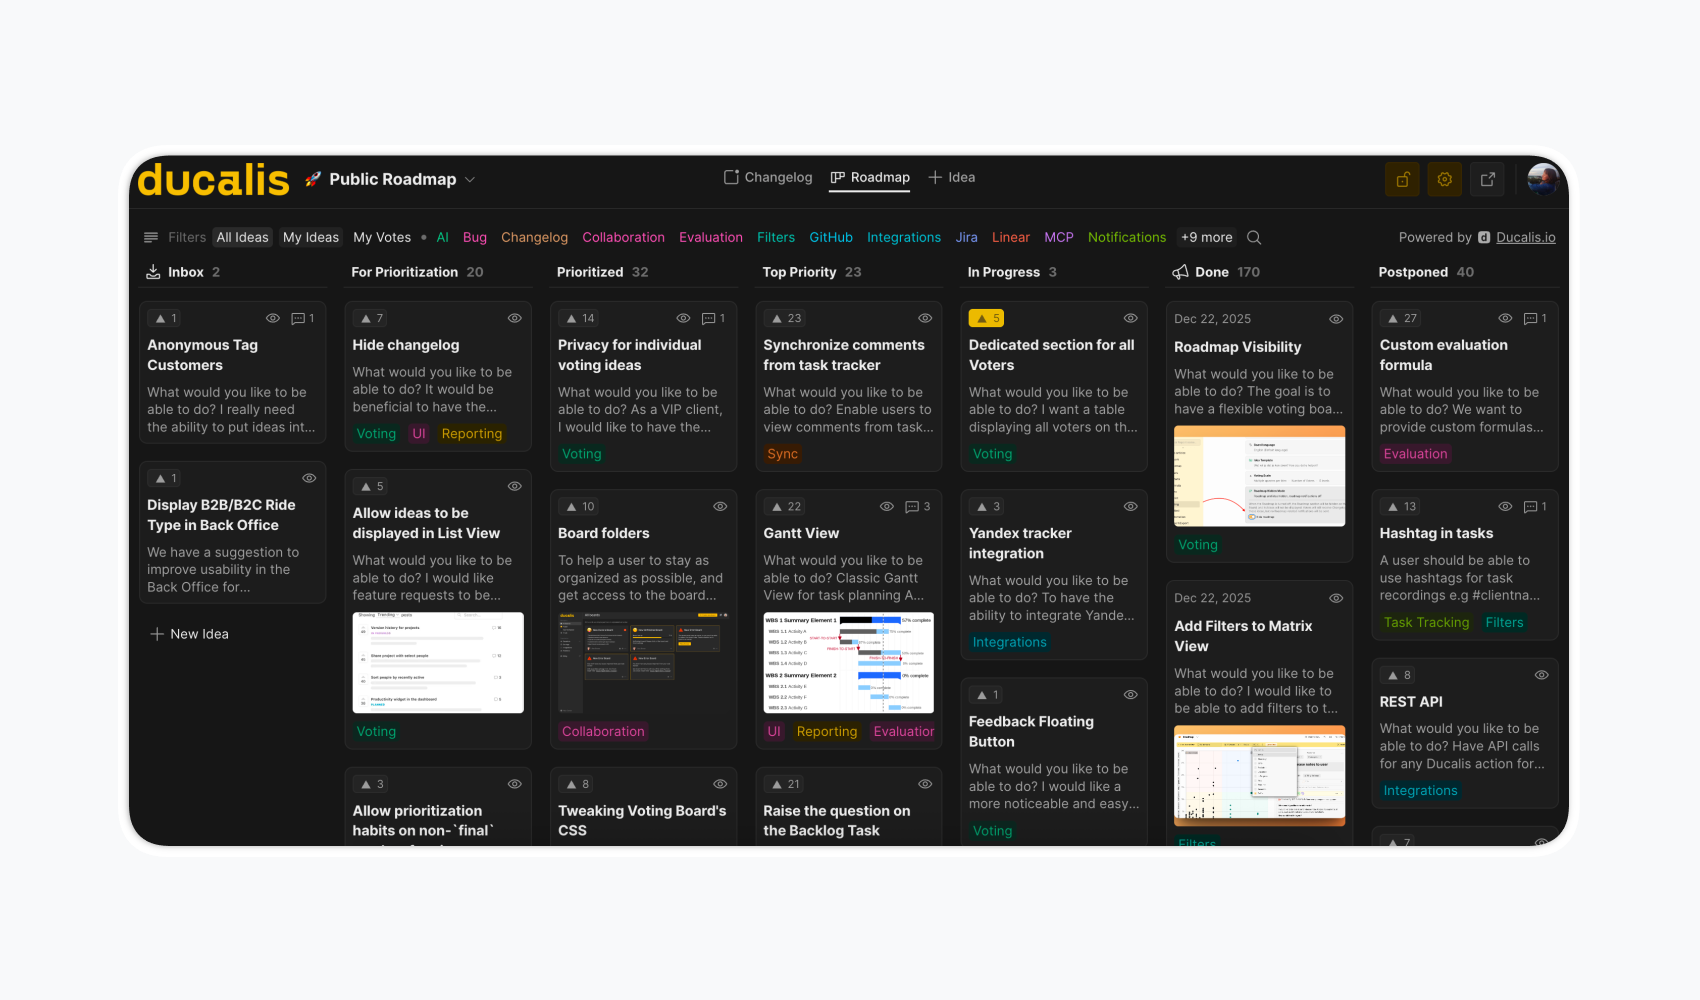
Public voting boards: Collect customer feedback externally, link ideas to internal backlog, and track voter data with customer properties—connecting external demand signals to internal prioritization.
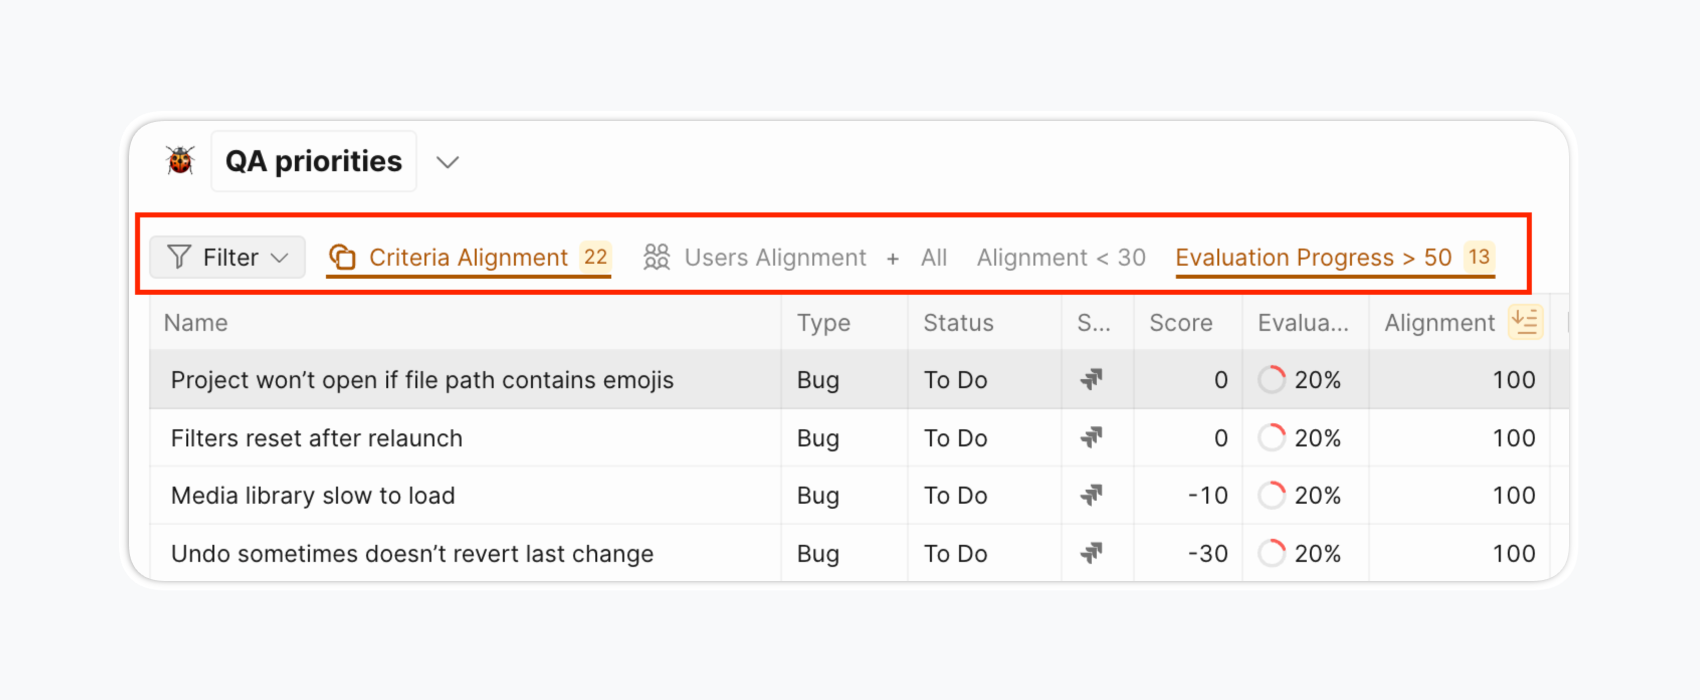
Custom filters: Create and save custom filters, share with team members, and customize table columns for different stakeholder views.
Combining Value vs Effort with other frameworks
Hybrid approaches often outperform single-framework prioritization:
Value vs Effort + MoSCoW: Draw release boundaries first using MoSCoW categories, then sequence items within each category using Value/Effort analysis.
Value vs Effort + Kano: Ensure basic expectations are covered, then add a deliberate "Delighter" each cycle—Kano categorization informs the value definition.
Value vs Effort + RICE: Use RICE for comparable numerical scoring when precision matters; use Value/Effort for visual communication to stakeholders.
Value vs Effort + Story Mapping: Map user journeys first to understand context, then prioritize within each journey stage.
Enhancement layers to consider:
- Add Confidence dimension when estimates are highly uncertain (becomes ICE-like)
- Break Value into Reach + Impact when feature audiences vary significantly (becomes RICE-like)
- Add Strategic Alignment axis for corporate initiatives that don't serve current customers but enable future growth
Related Articles
- How the Matrix Page Works — Understanding quadrants, views, and filtering
- Impact-Effort Matrix Fundamentals — Basic matrix concepts and quadrant definitions
- Optimizing the Eisenhower Matrix — Customizing criteria for your team
- Team Alignment Report — Finding and resolving estimation disagreements
- Evaluation Poker — Setting up silent voting for unbiased estimates
- Score Expiration — Keeping your matrix accurate over time
- Sprint Planning Settings — Configuring evaluation cadence
- Adding Evaluation Criteria — Setting up Value and Effort criteria with multiple estimators